Assessment of the River Water Quality Parameters of Masuso River and Maalsom River in Goa, Camarines Sur
Sierda Janine Pauline Sale
Partido State University Goa, Camarines Sur
This research explores the evaluation of the water quality parameters, in Masuso River and Maalsom River located in Goa, Camarines Sur, Philippines. The study highlights the significance of monitoring and management of water quality to ensure water resources and safeguard human health and the environment. A range of tests was conducted by the researcher to measure and analyze parameters in the samples, including salinity levels, total dissolved solids (TDS) electrical conductivity, pH levels, turbidity, coloration, phosphate concentration and total suspended solids. The findings from this study indicate that both rivers’ water quality adheres to the standards set by DENR Administrative Order. This study offers insights into the condition of water quality in the region and serves as a useful resource, for policymakers’ research and stakeholders dedicated to conserving and managing water resources sustainably.
Keywords: water quality, river, monitoring, management, sustainability, environment, Philippines
Water is essential for living organisms and is one of the precious natural resources for both human survival and development-related activities (Fawaz Al-Badaii & M. Shuhaimi-Othman, 2014; Roy, 2019; Salem 2021). Water has also played an important role in the establishment of the great civilization in the past most of which flourished near bodies of water. (Karikari and Ansa-Asare, 2006).
The Philippines is a developing country with abundant water resources, but it is burdened by a variety of environmental problems (Cabello et al., 2022) affecting its water quality. Water quality is “a term used to describe the chemical, physical, and biological characteristics of water concerning its suitability for a particular use”. Water quality testing is the process of analyzing a water sample to determine its characteristics and whether it meets certain standards or criteria for a specific use. In the Philippines, water quality is assessed based on set beneficial use as defined in the DENR Administrative Order (DAO) 34, Series of 1990, which contains 33 parameters that define the desired water quality per water body classification. The parameters used for water quality testing may include measures of pH, dissolved oxygen, biochemical oxygen demand, total coliform organisms, fecal coliform, nitrates, and salinity or chloride content, among others. (Greenpeace Southeast Asia, 2007). Water quality is a major concern in the Philippines because of its impact on public health, ecosystem health, and sustainable development. With its extensive network of rivers, lakes, and coastal areas, the country faces numerous challenges related to water pollution, contamination, and degradation. (Cabello, C. A., Canini, N. D., & Lluisma, B. C. 2022). However, in recent decades a continued deterioration in the quality of the water is noticeable since water is more susceptible to pollutants from both natural and anthropogenic sources. (Enguio &Matunog, et. Al, 2013;Parween et. al 2022). There are several factors that can contribute to the decline in water quality, including urbanization, agricultural practices, industrial activities, and insufficient waste management. These factors may cause contamination and degradation of river water, leading to health hazards for those who rely on these water sources. Pollutants such as sediments, nutrients, and urban runoff pollutants can have a negative impact on water quality. (Uddin, M., Alam, M., MN Mobin, & Md. Alim Miah 2015).
The quality of river water in Hiwacloy, Goa, Camarines Sur, Philippines, is of utmost importance for the well-being of local communities and the surrounding environment. Situated near Mt. Isarog which has many underground water sources, Goa is home to various rivers and water bodies that play a vital role in supporting livelihoods, ecosystems, and overall sustainability.
Thus, the purpose of this research is to evaluate the physico-chemical quality of the Masuso and Maalsom Rivers in Hiwacloy in Goa, Camarines Sur. This study intends to conduct water quality assessments at various locations along the river in accordance with the established parameters – surface water temperature, pH, turbidity, color, total dissolved solids, total suspended solids, electrical conductivity, salinity, and phosphate. In addition, the water quality of the rivers of Masuso and Maalsom river will be compared to the standards established by the Department of Environmental Resources (DENR) Administrative Order 2016-08 and Environmental Management Bureau of the Philippines (EMBP), and the World Health Organization (WHO).
Site Description and Sample Collection
Table 1. Exact location and description of two collection sites in Partido River Goa, Camarines Sur Philippines.
| Sampling site | GPS Coordinates | Description |
| Site 1 Masuso Spring River |
Latitude
13.70273° or 13° 42′ 10″ north 123.41277° or 123° 24′ 46″ east |
Spring
Category: body of water Location: Camarines Sur, Bicol, Luzon, Philippines, Southeast Asia, Asia |
| Site 2
Maalsom River, Goa, Camarines Sur |
Latitude
13.71667° or 13° 43′ north |
Stream
Category: body of water Location: Camarines Sur, Bicol, Luzon, Philippines, Southeast Asia, Asia |
The research study involved the collection of river water samples from two distinct sites, Maususo Spring River and Hiwacloy River, within the Goa municipality province of Camarines Sur of the Bicol region, Philippines. The first study site was Maususo Spring River, located at precise geographical coordinates of approximately 13.70273° north latitude and 123.41277° east longitude, equivalently expressed as 13° 42′ 10″ north and 123° 24′ 46″ east. Maususo Spring River serves as a prominent geographic feature within the Goa municipality, Camarines Sur. The second study site was Maalsom River positioned at coordinates 13.70780° north latitude and 123.4339° east longitude, further specified as 13° 42′ 28″ north and 123° 02′ 6″ east. Maalsom River is situated near Barangay Digdigon and Pinaglabanan in Goa, Camarines Sur, at an elevation of 904 meters above sea level. This detailed geographic information is integral to research, facilitating precise site characterization and analysis.
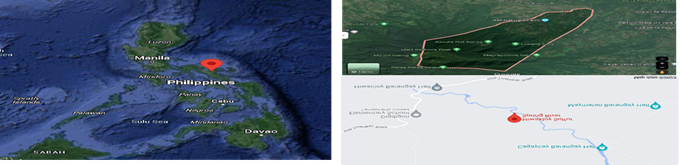
Fig. 1 . Map of the studied spring water of Masuso Spring River at, Goa, Camarines Sur
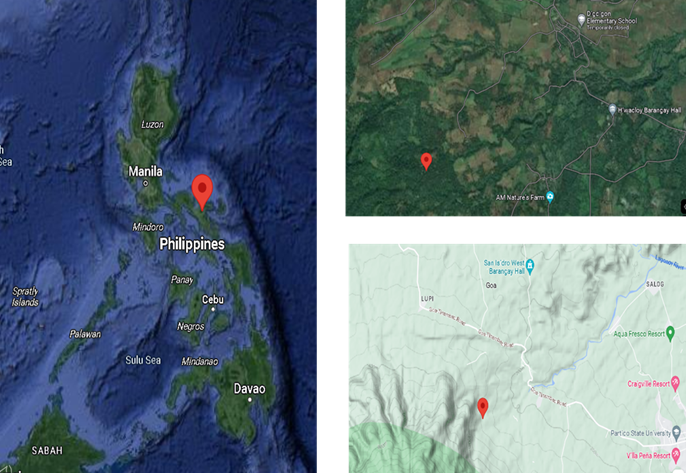
Fig. 2 . Map of the studied stream water of Maalsom River at Hiwacloy, Goa, Camarines Sur
Sampling
The sampling was carried out on August 21st, 2023, throughout the day to lessen the impact of weather-related factors. Glass bottles that had already been washed and sterilized were used to collect each sample. Before collecting water as the final sample for analysis, the bottles were prewashed with the water sample gathered. All samples were examined at the Partido State University Water Resource Quality Center (PSU).
Data Processing and Analysis
The relevant data for this study underwent thorough processing and analysis at the Water Resources Research Center, located in the Engineering Department of Partido State University. The researcher carefully conducted a series of tests to measure and analyze various parameters in the samples. A General Tools Datalogging Conductivity and Total Dissolved Solids (TDS) Meter was utilized to accurately measure the salt and TDS levels along with the electrical conductivity. Moreover, a DR900 Multiparameter Portable Colorimeter was employed to determine the sample’s pH, turbidity, color, phosphate concentration, and total suspended solids. These comprehensive tests ensured that the research was thorough, and the findings were reliable. To determine the temperature of collected samples, a laboratory thermometer was used. Temperature measurements were taken directly at the sampling sites.
Table 2. Physico-chemical Properties of Masuso Spring River, Goa, Camarines Sur.
Note: -: No standard value In this study, the researchers used multiple standards to assess the water quality of the samples. The standards used are from DENR Administrative Order No. 2016-8, DENR Administrative Order No. 2021-19, the Environmental Management Bureau of the Philippines, and the World Health Organization.
| Parameter | Unit | Samples | Water Quality Standards | |||||
| Trial 1 | Trial 2 | Trial 3 | Average | Department of Environment and Natural Resources
(DENR) |
Environmental Management Bureau of the Philippines | World Health Organization (WHO) | ||
| Color | Pt-Co | 20 | 18 | 25 | 21 | 50 TCU (Pt-Co) | — | — |
| Turbidity | FAU – Formazin Attenuation Units | 0 | 0 | 0 | 0.000 | — | — | 1-5 NTU |
| TDS- Total Dissolved Solids | mg/L | 55.53 | 51.13 | 55.6 | 54.087 | — | 1,000 mg/L | > 300 mg/L |
| TSS-Total Suspended Solids | mg/L | 4 | 1 | 1 | 2.000 | 50 mg/L | — | — |
| Electrical Conductivity | ms | 82.17 | 82.93 | 82.5 | 82.533 | — | — | 250 us/cm
Or 0.0025 ms |
| Salinity | ppm | 0 | 0 | 0 | 0.000 | — | 250 mg/L | > 1,000 ppm |
| Physical Temperature | Celcius | 22 | 22 | 22 | 22.00 | 26-30 C | — | — |
| pH | 6.36 | 6.3 | 6.26 | 6.31 | 6.5-8.5 | 6.0 to 9.0 | — | |
| Phosphate reagent | mg/L | 0.530 | 0.530 | 0.470 | 0.510 | 0.5 mg/L | 0.006 mg/L | — |
Table 3. Physico-chemical Properties of Maalsom River, Hiwacloy, Goa, Camarines Sur.
Note: — No standard value
| Parameter | Unit | Trial 1 | Trial 2 | Trial 3 | Average | DENR Standard | EMB Standard | WHO Standard |
| Colour | Pt-Co | 42 | 47 | 28 | 39 | 50 TCU (Pt-Co) | — | — |
| Turbidity | FAU | 0 | 0 | 0 | 0 | — | — | 1–5 NTU |
| TDS – Total Dissolved Solids | mg/L | 172 | 176.3 | 170 | 172.767 | — | 1,000 mg/L | > 300 mg/L |
| TSS – Total Suspended Solids | mg/L | 1 | 0 | 0 | 0.333 | 50 mg/L | — | — |
| Electrical Conductivity | mS | 0.254 | 0.259 | 0.241 | 0.251 | — | — | 250 µS/cm or 0.0025 mS |
| Salinity | ppm | 0.1 | 0.02 | 0.01 | 0.043 | — | 250 mg/L | > 1,000 ppm |
| Temperature | °C | 26 | 26 | 26 | 26 | 26–30 °C | — | — |
| pH | — | 6.43 | 6.44 | 6.48 | 6.45 | 6.5–8.5 | 6.0–9.0 | — |
| Phosphate Reagent | mg/L | 0.43 | 0.34 | 0.43 | 0.4 | 0.5 mg/L | 0.006 mg/L | — |
Table 4. Comparison of the Water Quality of Masuso Spring River and Maalsom River Relative to the Standards.
Note: -: No standard value
| Parameter | Unit | Masuso River | Maalsom River | DENR Standard | EMB Standard | WHO Standard |
| Colour | Pt-Co | 21 | 39 | 50 TCU (Pt-Co) | — | — |
| Turbidity | FAU | 0 | 0 | — | — | 1–5 NTU |
| TDS – Total Dissolved Solids | mg/L | 54.087 | 172.767 | — | 1,000 mg/L | > 300 mg/L |
| TSS – Total Suspended Solids | mg/L | 2 | 0.333 | 50 mg/L | — | — |
| Electrical Conductivity | mS | 82.533 | 0.251 | — | — | 250 µS/cm or 0.0025 mS |
| Salinity | ppm | 0 | 0.043 | — | 250 mg/L | > 1,000 ppm |
| Temperature | °C | 22 | 26 | 26–30 °C | — | — |
| pH | — | 6.31 | 6.45 | 6.5–8.5 | 6.0–9.0 | — |
| Phosphate Reagent | mg/L | 0.51 | 0.4 | 0.5 mg/L | 0.006 mg/L | — |
Color
The water quality for the color of the two sites (20 and 39 Pt-Co) was within the standard for recreational waters Class A based on DENR Administrative Order No. 2016-8. The observed average color value of water is 20 Pt-Co and 39 Pt-Co suggesting that the water sample’s coloration is suitable to the standard acceptable limit of 50 Pt-Co. It is noteworthy that the Masuso River exhibits a lower magnitude of dissolved elements as indicated by its color evaluation when compared to the Maalsom River. This observation implies that the water composition of the Masuso River may contain a comparatively higher level of impurities, even though both rivers remain within the acceptable color range defined by regulatory standards. This implies that the water exhibits less color intensity, indicating that the water sample has a low accumulation of dissolved materials. This further indicates a more appealing visual quality, which can be relevant for applications where aesthetics and visual appeal are vital, such as drinking water, recreational water bodies, and decorative water features. This also further suggests that the water quality of both the Masuso River and the Maalsom River can be categorized as Class A based on the relevant criteria set of DENR.
Turbidity
Turbidity itself does not directly impact human or animal health, but it can hinder the effectiveness of water decontamination and disinfection processes, providing a medium for microbial growth. The study results indicate that both sites had a turbidity reading of 0.00 FAU, which is within the permissible range according to DENR and WHO guidelines, ideally not exceeding 1 NTU or FAU. Since the water turbidity is low which for both rivers falls at 0.00, it means that there are fewer suspended particles in the water and it is clearer. This can be an indication of good water quality, as high turbidity levels can make it difficult for aquatic plants and animals to survive and can also make it harder to treat water for human consumption. Although the water’s turbidity falls within acceptable limits, exceeding 1 NTU or FAU can disrupt water purification processes like flocculation and filtration. The researchers employed FAU (Formazin Attenuation Units) for testing rather than NTU, and it’s important to acknowledge the consistency of these units when evaluating turbidity data. According to Pure Water Gazette» Measuring Turbidity: NTU, FTU, FAU, 2019, although the scales measure of turbidity are different, they are essentially the same in value. 1 NTU = 1 FTU = 1 FAU. Turbidity measurements can be complex due to various units like NTU, FAU, and FTU, with values of 1NTU/FAU requiring treatment.
Total Dissolved Solids (TDS)
The recorded Total Dissolved Solids (TDS) data for the Masuso River, measuring 54.087 mg/L, and the Maalsom River, measuring 172.767 mg/L, both fall within the specified range standards set by the Environmental Management Bureau of the Philippines and the World Health Organization. These standards have established acceptable TDS levels ranging from less than 300 mg/L to 1000 mg/L, respectively. Given that the TDS levels of both water bodies remain within these acceptable ranges, it indicates a reduced likelihood of the presence of additional contaminants in the water, such as heavy metals, salts, or other potentially harmful chemical compounds. Exposure to these contaminants can lead to various health issues, including gastrointestinal problems, kidney damage, and neurological disorders.
Total Suspendeded Solid
The concentration of solid particles suspended in water is measured by Total Suspended Solids (TSS), which is a crucial parameter. At Site 1, the average TSS value of 2.000 ppm indicates that there is a moderate concentration of suspended solid particles in the water. This suggests that the water at Site 1 has a noticeable amount of suspended matter. However, the average TSS value of 0.333 ppm at Site 2 signifies a relatively lower concentration of suspended solids compared to Site 1. This suggests that the water at Site 2 carries fewer suspended particles.
The distance between Site 1 and Site 2 has a significant impact on water quality and the health of the ecosystem. Site 1 has higher levels of suspended particles, which could reduce clarity and negatively affect light penetration. This, in turn, could harm the growth of aquatic plants and the visual appeal of the area. Sedimentation can also smother aquatic habitats, harming bottom-dwelling organisms and affecting fish spawning. On the other hand, Site 2 has lower levels of TSS, which is positive for water clarity. Improved clarity allows for better light penetration, which supports healthier aquatic vegetation. Effective erosion control measures can also minimize sediment runoff and its associated impacts. The difference in Total Suspended Solids (TSS) values between Sites 1 and 2 can be attributed to various factors. In Site 1 might experience activities like construction, deforestation, or agriculture that increase soil erosion, and natural processes like rainfall and wind can erode exposed soil. In site 2, adequate vegetation can act as a barrier against erosion, reducing sediment runoff.
Electrical Conductivity
Electrical conductivity (EC) is a crucial parameter used to assess the concentration of dissolved ions in water bodies. The average EC value of 82.533 mS at Site 1 indicates a relatively high concentration of dissolved ions in the water. While the average EC value of 0.251 mS at Site 2 signifies a very low concentration of dissolved ions compared to Site 1. This extremely low EC value indicates that the water at Site 2 has minimal dissolved substances.
Based on the findings on the results, the implications of the average value at Site 1 high EC levels might indicate increased mineral content and pollutants in the water, potentially affecting aquatic life and ecosystem dynamics and might be unsuitable for certain applications like irrigation or drinking, requiring treatment or careful management. While, the low EC value at Site 2 indicates minimal dissolved ions suggesting a relatively unpolluted and less mineral-rich environment, which is positive for aquatic ecosystems and can be more suitable for various uses including agricultural and environmental purposes
Factors that contribute to Site 1 may include a geological composition that might contain mineral-rich formations, contributing dissolved ions, and increasing EC. While the absence of mineral-rich formations or geological processes might lead to lower ion content.
Salinity
The average salinity value of 0.000 ppm at site 1 indicates that the water at this location has an extremely low concentration of dissolved ions. A measurement of 0.000 ppm suggests that there are virtually no detectable dissolved ions in the water. The average salinity value of 0.010 ppm at site 2 indicates a very low concentration of dissolved ions in the water, though slightly higher than at site 1.
The implications of this finding are that the water at Site 1 is considered freshwater due to the absence of significant dissolved ions. It is likely suitable for a wide range of uses, including drinking, irrigation, and supporting aquatic life. The low salinity indicates a relatively natural environment with minimal influence from sources that introduce salts into the water. This can be beneficial for maintaining the health of aquatic ecosystems. The water at Site 2 is still considered suitable for various uses, including drinking and most agricultural purposes. However, specific crops sensitive to salinity might be impacted if the salinity increases further.
The observed average salinity values at Site 1 and Site 2 reflect differences in the concentration of dissolved ions in their respective water sources. Several factors contribute to Site 1 have the geological makeup of an area can influence the mineral content and salinity of the water, and high levels of rainfall or effective dilution from freshwater sources can significantly lower water salinity. While Site 2’s slightly higher salinity could be influenced by human-induced pollution and activities like irrigation and industrial discharges, natural processes like weathering and erosion can introduce or remove salts from water bodies,
Temperature
Based on the result of an average temperature of site 1 which recorded as 220. This temperature may affect the plants in the area. While some aquatic plants tolerate cooler waters, most prefer warmer temperatures, tropical plants in particular will show restricted growth and dormancy in water temperatures below 22°C, and site 2 we have average of 26 0C based on the DENR water quality for primary parameters of the water body classification B.
The implication temperature of water influences the rate of chemical and biological reactions. It affects the dissolved oxygen level in water, the photosynthesis of aquatic plants, the metabolic rates of aquatic organisms, and the sensitivity of these organisms to pollution, parasites, and disease. Temperature is an important factor to consider when assessing water quality. In addition to its effects, temperature influences several other parameters and can alter the physical and chemical properties of water. In this regard, water temperature should be accounted for when determining 7 Metabolic rates and photosynthesis production, Compound toxicity, Dissolved oxygen and other dissolved gas concentrations, conductivity and salinity, Oxidation-reduction potential (ORP), pH, and Water Density.
pH
Analysis of the water samples revealed average pH levels of 6.31 at Site 1 and 6.45 at Site 2. Based on the Department of Environment and Natural Resources (DENR) water quality classification for primary parameters, both sites fall within the D classification, which ranges from 6.0 to 9.0 pH
The pH levels at both sites (6.0-9.0) are generally suitable for most fish, which can adapt to this range as long as there are no sudden changes. pH is influenced by alkalinity, which in turn depends on dissolved salts, carbonates, and soil composition (higher alkalinity typically results in higher pH). For optimal fish health, alkalinity should be at least 20 mg/L, with ideal CaCO3 levels between 75 and 200 mg/L. Factors affecting the pH level of the water in general, chemicals, minerals, pollutants, soil or bedrock composition, and any other contaminants that interact with a water supply will create an imbalance in the water’s natural pH of 7. In short, environmental factors are the biggest contributor to water pH, whether high or low.
Phosphate
Both Site 1, with an average phosphate level of 0.50 mg/L, and Site 2, with an average of 0.40 mg/L, fall under the DENR’s A classification for water body quality. The implication of the result of the phosphate test to both sites rivers, with excess phosphorus can grow algae, which sets off a vicious cycle. Algae blooming can hinder recreation such as swimming, while also damaging habitat for fish and other aquatic species. Factors affect Phosphates are usually present in the environment in low concentrations, which limits plant growth. High phosphate levels can come from man-made sources such as septic systems, fertilizer runoff, and improperly treated wastewater. The phosphates enter the water as the result of surface run-off and bank erosion. Many detergents contained phosphates before manufacturers developed phosphate-free alternatives. An increase in nitrate levels may cause an increase in phosphate levels.
Ensuring the suitability of water for its intended purposes is of utmost importance, and thus evaluating its quality becomes highly significant. This process involves assessing various parameters and comparing them to established standards to determine whether the water meets acceptable criteria. This study evaluated the water quality of Masuso River and Maalsom River in Goa, Camarines Sur, Philippines, and found that both rivers have different levels of water quality. Masuso River has fewer impurities, while Maalsom River has higher concentrations of dissolved materials. Factors such as geological composition and human activities contribute to the water quality of each river. The study used various parameters, such as electrical conductivity, total dissolved solids, pH, turbidity, color, phosphate concentration, and total suspended solids, to assess the water quality. The researcher conducted numerous tests to ensure the reliability of the findings. The study emphasizes the importance of regular water quality monitoring and management to ensure sustainable water resources and protect human health and the environment. The current state of water quality in the Philippines is concerning, with pollution and human activities posing significant environmental problems. Effective solutions are urgently needed to address these issues. This study provides valuable insights into the current state of water quality in the region and serves as a useful resource for policymakers, researchers, and stakeholders working towards the protection and sustainable management of water resources in Goa, Camarines Sur, Philippines, and beyond. Continued efforts are necessary to monitor and manage water quality to ensure the availability of this precious natural resource for future generations.
Despite the current water quality of the Masuso and Maalsom Rivers in Goa, Camarines Sur, meeting DENR standards, continuous monitoring and proactive management are recommended. This will safeguard both human health and the environment, ensuring long-term water resource sustainability. To that end, comprehensive water quality policies, grounded in scientific research and adaptable to environmental changes, should be developed. This study provides a vital foundation for policymakers, researchers, and stakeholders in formulating effective water resource management strategies.