Environmental and Social Risk Mapping to Address Esg Program Initiation for Sustainable Post-Mining Management – Learn From Indonesian Artisanal and Small-Scale Gold Mining (Asgm)
Authors: Arisandi Dwiharto, Hanif Azhar, Sigit Kusumanugraha, Masdar Fahmi, Roqib Mutaali.
With a lengthy history of gold mining, Indonesia has made a major contribution to global gold production. This is valid not only for big gold mining firms but also for small-scale mining associations made up of individuals and businesses involved in Indonesia’s gold sector. There are currently around 2,000 gold mining sites in Indonesia. Thirty regions in Indonesia are home to artisanal and small-scale gold mining operations that have employed over two million people and generated revenue. However, most ASGM operations use antiquated technology that negatively affects the environment, public health, and miners’ safety. This affects the socioeconomic conditions of those who live near the mine sites.
Social mapping is a powerful tool for visualizing economic risks, understanding their social impact, and designing effective mitigation strategies. The benefits of social mapping extend beyond risk analysis, promoting transparency, inclusivity, and collaboration in economic risk management. Otherwise, effective risk mitigation is essential for the success of post-mining programs. By engaging stakeholders, understanding social perception, and implementing the social mapping approach, mining activities can ensure sustainable development and positive community outcomes. Continuous evaluation and improvement of risk mitigation efforts will further enhance the effectiveness of post-mining programs and key success for Environmental Social Governance (ESG) sustainability program initiation.
Keywords: Social Risk, Social Mitigation, Post-Mining Program.
In the bustling gold mines of Indonesia, where artisanal and small-scale mining is a common practice, the implementation of effective risk mitigation strategies is crucial. One such strategy gaining popularity is social mapping. Social mapping is a powerful tool that utilizes visual representations to identify and understand the social landscape surrounding mining activities. Mining operators can better manage potential risks and promote sustainable practices in post-mining activities by mapping out the relationships, dynamics, and resources within a community. Community perception plays a crucial role in shaping our understanding of the world around us. It influences our beliefs, decisions, and actions, especially when it comes to matters of safety and risk mitigation.
Social mapping is a method used to visually represent the social and cultural aspects of a community. It involves identifying key stakeholders, mapping out their relationships, and highlighting the resources they possess or have access to. This process helps to create a comprehensive picture of the community’s social fabric, enabling mining operators to identify potential risks and opportunities for collaboration. By understanding the intricate connections within a community, mining operators can develop targeted interventions and engage stakeholders effectively.
Post-mining activities often pose significant risks to both the environment and the community. Without proper risk mitigation strategies, these activities can lead to environmental degradation, social conflicts, and economic instability. Social mapping plays a vital role in risk mitigation by providing a holistic understanding of the community’s needs, concerns, and aspirations. By involving the community in the decision-making process, mining operators can ensure that post-mining activities align with their expectations and contribute to sustainable development.
Sustainability is a key concern in the mining industry, and social mapping offers several benefits in this regard. Firstly, it promotes transparency and accountability by involving stakeholders in the decision-making process. This fosters trust between the community and mining operators, leading to more sustainable practices. Secondly, social mapping helps identify areas of potential conflict, enabling proactive measures to be taken to avoid or mitigate those conflicts. Lastly, social mapping facilitates the identification of opportunities for collaboration and resource sharing, leading to more sustainable and inclusive development.
One essential measure of non-financial business activity performance is ESG. ESG indicators, according to investors who support the idea of socially responsible investing, provide insight into a company’s long-term performance. ESG policies and disclosures create value for the company’s investors, other stakeholders, and the community by reflecting a voluntary commitment to non-financial goals and sustainable development. ESG risk mapping involves a multi-disciplinary approach, considering both environmental and social risk factors (Chupryakova et al., 2023).
Social Mapping can convey complex information clearly and concisely. They provide a visual representation of data, making it easier for individuals to understand and interpret. When it comes to community mapping and risk mitigation, visual tools can play a crucial role in identifying potential risks, understanding community dynamics, and developing targeted interventions. Additionally, qualitative data and insights from the community can be gathered through participatory mapping exercises, such as focus group discussions and community workshops. When combined, these tools and techniques give a better understanding of the social dynamics within a mining community.
Social Mapping
Social mapping involves the collection, analysis, and visualization of social data to gain a comprehensive understanding of complex issues. By mapping social networks, relationships, and interactions, social mapping provides a visual representation of the social fabric surrounding economic risks (Kivinen et al., 2018). This enables policymakers, businesses, and communities to identify vulnerable areas, anticipate potential cascading effects, and design tailored mitigation strategies (Albrieu, R., & Palazzo, 2020). By harnessing the power of social mapping, stakeholders can make informed decisions that lead to a more resilient and adaptive economy .
The ability to accurately assess community perception is essential for creating effective strategies to address potential risks and ensure the well-being of individuals and communities (Muslihudin et al., 2020). In this article, we will explore the power of visual tools in community mapping and risk mitigation and how technology can enhance the process.
Social mapping allows for the identification of key social factors that influence the vulnerability and resilience of communities in the face of economic risks. It helps uncover hidden relationships, dependencies, and networks that can amplify or mitigate the impact of risks (Karwowski & Raulinajtys-Grzybek, 2021). For example, mapping social networks can reveal how information flows within a community, enabling targeted communication strategies during times of economic uncertainty. Additionally, social mapping can highlight the social capital and resources available within a community, facilitating effective collaboration and resource allocation in times of crisis (Naseem et al., 2020).
In today’s interconnected world, maintaining social and cultural order is crucial for the harmony and well-being of society. Social culture order refers to the norms, values, and behaviours that govern our interactions with others (Agus & Dwimawanti, 2020). It ensures that individuals can coexist peacefully, respecting each other’s rights and differences. However, achieving and sustaining social culture order can be challenging due to the complexities of human interactions. In this article, we will explore the role of visual tools in mitigating risks and promoting social culture order (A. Fonseca et al., 2014).
Social and Economic Impact
One of the greatest strengths of social mapping is its ability to visualize complex data in a way that is easily understandable and actionable. Social mapping provides a complementary approach by incorporating qualitative and contextual data, allowing for a more nuanced understanding of the risks (Eizenberg & Jabareen, 2017).
By visualizing economic risks through social mapping, stakeholders can identify patterns, trends, and interdependencies that may not be apparent through traditional analysis. These visual representations, such as network diagrams, heat maps, and geographic overlays, enable decision-makers to grasp the magnitude and scope of the risks at a glance (Faivre et al., 2017). This visual clarity not only facilitates communication and collaboration but also enhances risk perception and understanding among stakeholders. As a result, strategies for risk mitigation can be developed more effectively, with a greater likelihood of success.
The use of social mapping in economic risk analysis offers numerous benefits for stakeholders across various sectors. Firstly, social mapping allows for early detection and prediction of economic risks by capturing real-time social data. By monitoring social media, news feeds, and online discussions, potential risks can be identified and assessed promptly. This proactive approach to risk management enables pre-emptive measures to be taken, minimizing the impact on the economy (Naseem et al., 2020).
Secondly, social mapping facilitates targeted and tailored risk mitigation strategies. By understanding the social context and dynamics surrounding economic risks, stakeholders can develop interventions that address specific vulnerabilities and leverage existing social capital. For instance, social mapping can reveal community leaders and influencers who can be engaged in risk communication and mobilization efforts (Karwowski & Raulinajtys-Grzybek, 2021). By harnessing the existing social networks and trusted relationships, the effectiveness of risk mitigation measures can be significantly enhanced.
Lastly, social mapping promotes transparency and inclusivity in economic risk management. By making social data accessible and visual, stakeholders can actively participate in the risk assessment process (Tolvanen et al., 2019). This participatory approach fosters trust, engagement, and collaboration among diverse stakeholders, leading to more effective risk mitigation strategies. Additionally, social mapping can help identify marginalized or vulnerable groups who may be disproportionately affected by economic risks, ensuring that their needs are adequately addressed in the mitigation strategies.
Moving forward, social mapping for economic risk mitigation is poised to benefit from several emerging trends and advancements (Tolvanen et al., 2019). One such trend is the increasing availability of big data and advanced analytics techniques. As more social data becomes accessible and computational power improves, stakeholders can gain deeper insights into economic risks and their social impact. Machine learning algorithms and artificial intelligence can be applied to social mapping, enabling automated analysis and real-time risk monitoring.
Visual Tool for Social Mapping & Risk Mitigation
The use of visual tools for social mapping and risk mitigation offers numerous benefits. (Albrieu, R., & Palazzo, 2020) has explained and grouped into 3 benefits: Firstly, visual tools provide a holistic view of the community, enabling decision-makers to identify interconnected risks and develop comprehensive strategies. By visualizing data in a spatial context, decision-makers can understand how different factors interact and impact the community’s well-being.
Secondly, visual tools enhance communication and collaboration among stakeholders. By presenting information in a visual format, complex concepts can be easily understood and shared (Kivinen et al., 2018). This facilitates meaningful discussions and encourages active participation from community members, leading to more inclusive and effective risk mitigation strategies. Lastly, visual tools promote transparency and accountability (L. M. Fonseca et al., 2020). By making data accessible to all stakeholders, decision-making processes become more transparent, and individuals can hold decision-makers accountable for their actions. This fosters a sense of trust and cooperation within the community, leading to better outcomes in risk mitigation efforts (Faivre et al., 2017).
Ratatotok Subdistrict is one of the sub-districts in Southeast Minahasa Regency, about 102 km from Manado City, the capital of North Sulawesi Province. Ratatotok Subdistrict has 15 (fifteen) villages, most of which are located at an altitude of less than 100 meters from sea level and are coastal areas. At the end of 2022, the total population of the Ratatotok Subdistrict was 14.472 people, average population density of 139 people/km2 (BPS Minahasa Tenggara, 2023). This number includes both permanent residents and non-permanent residents.
There are two kinds of gold mining activities in Ratatotok sub-district, namely the people’s gold mine and the gold mine managed by PT Newmont Minahasa Raya (PT NMR). The one managed by PT NMR was completed in 2006. In the Ratatok region, mining activities have existed since 1850 (Momongan, 2023). Mining activities at that time were carried out by local people who came from Bolaang Mongondow. The Dutch colonial government began mining at the site around 1898, running in tandem with artisanal mining.
In the mining process carried out traditionally by the people, Hg amalgam is usually used to extract gold from gold ore which amounts to 2-3 times the amount needed (Mariwy et al., 2019). Herein lies the problem, illegal gold mining activities that have metamorphosed into a kind of industry have caused public unrest because of the negative impacts they cause. At the lowest, artisanal mining activity has an impact on changing the color of the post-mining lake water (ex-mine void) in the Megawati Soekarnoputri Forest Park Area to yellowish.
Until now, in the Ratatotok area, there are still legal gold mining activities that have obtained a Mining Business License – Production Operation (commonly abbreviated: IUP – OP) gold commodity. Where this activity is outside the Megawati Soekarnoputri Forest Park area, this activity is side by side with illegal mining activities. This legal mining activity sometimes uses explosives for rock clearing activities that have an impact on illegal mining in the Forest Park (Lutfillah, 2011). In Figure 1 below, the following situation of the location of illegal mining in the Ratatotok area which is right around the post-mining lake of PT. NMR. These illegal miners use lake water to separate gold from soil or rock material that has been excavated.
The Assessment Team for the Success of Ex-Mining Forest Reclamation of North Sulawesi Province has also concluded that the realization of planting implementation has reached 100%, the realization of the number of plants is 152.83% (based on the Regulation of the Minister of Forestry No. 60/2009) with a plant health rate of 97.68%, and the presentation of local plants is 99.91%. PT NMR handed over reclaimed forests to the Indonesian government in 2011 (Witono et al., 2020).
The central level PT NMR Forest Reclamation Success Assessment Team concluded that the success score of PT NMR forest reclamation in Ratatotok, Southeast Minahasa Regency reached 93%, higher than the standard set by the government for the good category (Purnomo et al., 2018).
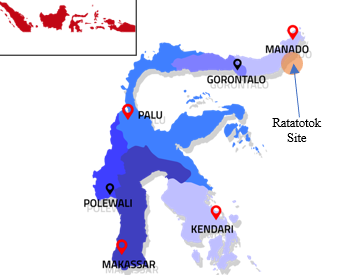
Fig 1 a. The situation of Sulawesi Island Map
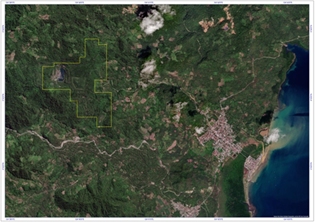
Fig 1b. Ratatotok Village & Megawati Forest Park (source: Google Maps, 2023
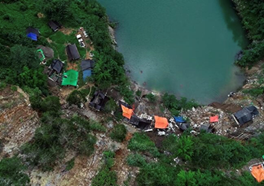
Fig 1c. Illegal Gold Miners around the Lake of PT. NMR Post Mining
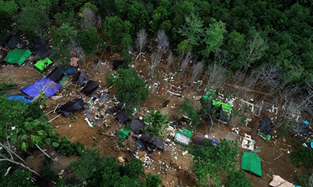
Fig 1d. Illegal gold Miners located at Megawati Soekarnoputri Forest Park Area
This type of research is a case study, which is understood by Creswell (2016) as a type of research that can be interpreted as an approach to study, explain, or interpret a case in its natural context without outside interference. Implementing visual tools for effective social mapping and risk mitigation requires careful planning and consideration (Kikuchi & Takahashi, 2022). Here are some steps to guide the implementation process in Figure 2:
This research data is qualitative and consists of primary data and secondary data. Most of the primary data were collected through focus group discussion (FGD) direct observations in the field, while a small part of the other data was obtained from documents and physical devices related to gold mining and the socio-culture of Southeast Minahasa Regency. The FGD was conducted to explore the experiences of subjective respondents and their opinions on gold mining and socio-culture in Southeast Minahasa Regency.
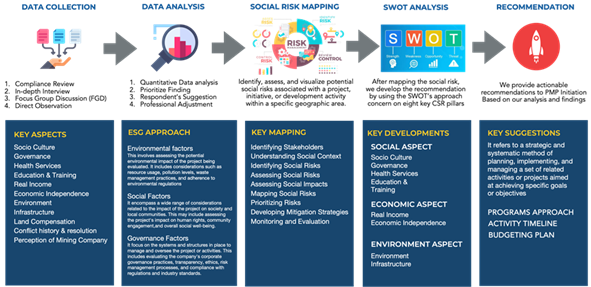
Figure 2. Methodology for ESG program initiatives in the Post-Mining Programmes (PMPs)
The FGD was based on their involvement with the phenomenon that became the topic of research, namely illegal gold mining side by side with public hype around the illegal mine in Southeast Minahasa Regency. This interview is based on an interview guide. Informants are selected using a proportional method and divided into four parts, which are presented in Table 1 below.
Table 1. Number and Position of Informants
| Position | Number of Informants | Distribution |
| Village Head & Village Consultative Body | 27 | 9 village |
| Community leaders | 18 | 9 village |
| Gold miners | 16 | 2 Gold mining Corporation, and 16 small scale illegal gold mining |
| The general public representing social activists | 7 | 9 village and 1 district |
However, researchers always develop questions in various directions according to the development of informant responses to obtain complete, in-depth, and accurate information. In this case, each discussion is directed at a topic that in the view of the researcher is the competence of the informant concerned according to their respective status, not neglecting to extract general information. The researcher records all dialogue that occurs during the interview and makes additional notes as necessary. The recording was then converted into a transcript of the interview conducted after the interview was conducted.
While visual tools offer numerous benefits, there are also challenges associated with their implementation (Gao et al., 2021). One challenge is the availability and accessibility of data. In some cases, relevant data may be scarce or difficult to obtain. To address this challenge, organizations can collaborate with government agencies, research institutions, and community members to collect and share data.
Social Mapping Data And Analysis
Technology has revolutionized the way we collect, analyze, and visualize data. In the context of community perception and risk mitigation, technology can enhance the accuracy and efficiency of visual tools. For example, social media platforms and online surveys can be used to gather real-time information about community perceptions and concerns. This data can be analyzed and visualized using specialized software, allowing decision-makers to identify trends and patterns (Mwakumanya & Mwachupa, 2018).
In addition to data collection, technology also enables the creation of interactive visual tools. Virtual reality and augmented reality platforms, for instance, can provide immersive experiences that simulate real-life scenarios (Kivinen et al., 2018). This allows individuals to better understand potential risks and make informed decisions. By harnessing the power of technology, we can create visual tools that engage and empower communities in the risk mitigation process.
Social Culture Order
Maintaining social-cultural order is crucial for the harmony and well-being of society. Social culture order refers to the norms, values, and behaviors that govern our interactions with others (Edwards et al., 2022). It ensures that individuals can coexist peacefully, respecting each other’s rights and differences (Albrieu, R., & Palazzo, 2020). However, achieving and sustaining social culture order can be challenging due to the complexities of human interactions. In this article, we will explore the role of visual tools in mitigating risks and promoting social culture order:
The majority of the population is in the productive age, a significant portion of the population is in the age range where they are considered to be at their most productive, typically referring to the working-age population. In this case, approximately 68.87% of the population falls within this age group.
The level of education is considered high, The overall education level in the community is relatively high, with most villages having a majority of individuals who have completed their high school education. Additionally, there are certain villages where the number of people holding a bachelor’s degree is more than 20 individuals.
Unique natural landscapes, Unique natural landscapes in Ratatotok, consist of coastal areas and low to highlands. Ratatotok has unique and diverse natural landscapes, which include a variety of features such as coastal areas and terrains that range from lowlands to highlands.
The large number of migrants engaging in illegal mining, The significant issue of a high number of people (+ 3.000 people) from other areas or regions coming to Ratatotok to participate in illegal mining activities. It highlights the concern regarding the impact of unauthorized mining operations conducted by these migrants.
Gold mining is the main livelihood of Ratatotok residents. gold mining has been the primary source of income for most people in Ratatotok for a long time, even before the arrival of the IUP – OP gold mine.
Social Interaction
Social interaction is the foundation of any society. It involves the exchange of information, ideas, and emotions between individuals. Through social interaction, we form relationships, communicate our needs and desires, and develop a sense of belonging. In this article, we will look at how visual tools can help reduce social interaction risks:
The heterogeneous and open-minded community, the community is diverse and consists of people from different religious and ethnic backgrounds. However, despite their differences, the community is characterized as open-minded and accepting
The participation of women in social aspects is high, The women’s involvement and representation in various areas of governance, economy, and society are significant. Some women hold important leadership positions such as Village Chief, Village Consultative Body members, and Head of Community Units.
Social Perception
Social perception plays a significant role in maintaining social culture order. It refers to how individuals interpret and understand the behavior and intentions of others (Agus & Dwimawanti, 2020). Our perception of others influences our attitudes, beliefs, and actions toward them. When social perception is accurate and unbiased, it promotes empathy, understanding, and cooperation. The use of visual aids to reduce hazards and encourage social perception will be discussed in this article, including:
The community acknowledges the society figures, certain individuals or figures hold importance and are recognized by the community for their roles and contributions. These figures may have significant influence or leadership positions within the community.
The village government actively performs duties and functions, and the village institutions, including the village government and the Village Consultative Body (BPD), are still operational and actively carrying out their respective roles and responsibilities.
The social bonds of the community are starting to loosen, The social cohesion or ties within the community are weakening or becoming less strong. It implies that there might be a decrease in social connections, interactions, or shared values among the members of the community.
Negative perception of local people’s ability, The community has a negative perception of the skills and abilities of individuals within their village, which affects the successful implementation of group-based economic management initiatives like Village-Owned Enterprises (BUMDES).
Not all individuals rely on external assistance, a significant portion of the community relies on mining activities as a major source of livelihood or income. Mining plays a crucial role in the local economy, and many people in the community are dependent on it for their livelihoods.
Environmental Needs
Environmental risk mapping is a powerful tool for identifying and assessing potential environmental risks associated with mining activities. Environmental risk mapping helps ensure that post-mining activities are conducted in an environmentally responsible manner, minimizing negative impacts on ecosystems and natural resources (Tolvanen et al., 2019). The following is an overview of the basic needs in urgent environmental aspects:
The clean water issue has become a fundamental problem, The lack of access to clean water is a significant and fundamental issue that the community is facing. It highlights the importance of addressing and resolving the problem of clean water availability to meet the basic needs of the people.
The dependency on basic needs remains very high, The community’s reliance on supplies of essential items, such as rice, vegetables, meat, and fruits, from other regions is still significant. It implies that the local area may not be fully self-sufficient in meeting its basic needs and relies heavily on external sources for these necessities.
Crucial Issue
To maintain social culture order effectively, it is essential to identify potential social conflicts before they escalate. Visual tools can play a crucial role in this process. By providing a visual representation of social interactions and dynamics, these tools can help identify patterns, trends, and potential conflicts. By identifying potential conflicts early on, proactive measures can be taken to address them and maintain social culture order. The following are crucial issues that occur in the community around small-scale gold mining activities are:
Security Issue, The Ratatotok area is generally considered safe. However, a concerning issue arising from the influx of mining migrants is the prevalent culture of alcohol consumption and partying. Incidents of fights escalate from minor triggers after individuals have consumed alcohol. This situation is commonly referred to as gambling, quarreling, and brawling due to alcohol intoxication.
The village regulations exist but are not clear-cut, The Village Chief has established rules, such as requiring newcomers to report their presence within 24 hours, but there are challenges in enforcing these regulations as some newcomers do not comply. Additionally, in cases of land disputes, the Village Chief considers original and valid land documents or older dated documents to resolve the conflicts.
The illegal miners around the IUP area, The presence of illegal miners or unauthorized miners around IUP – OP Gold Mine has been subject to multiple enforcement actions or sweeps, but they have never been found in the field. This strengthens our analysis that illegal miners or unauthorized miners might also be receiving protection from influential figures or individuals in higher positions of authority.
The Income Potential is highly attractive, The potential to earn a significant amount of money (about IDR 30 Million per month per person) from the described activities is highly attractive or tempting. It implies that the income opportunities presented are lucrative and have the potential to generate substantial earnings.
Blasting Incident, an incident where the blasting activities conducted by IUP – OP Gold Mine caused damage to a resident’s garden, leading to cracks in the land. However, the company took immediate action and collaborated with the affected residents to address and resolve the problem.
Environmental issue on waste disposal practice, The concerns and complaints raised by the community regarding the waste disposal practices of the company.. The community emphasizes the importance of resolving this matter to avoid potential problems related to public health and potential conflicts in the future.
Social Mapping Risk
One successful example of utilizing social mapping risk for community perception and risk mitigation is the Post Mining Program (PMP). The PMP is a collaborative effort between government agencies, mining companies, and local communities to address the social and environmental impacts of mining activities (Amelia et al., 2019).
The PMP uses visual tools, such as GIS and drone technology, to monitor and assess the impact of mining on the surrounding communities. By overlaying data on land use, water quality, and air pollution onto a map, decision-makers can identify areas that require immediate intervention (Rahim, 2017). This allows for targeted risk mitigation strategies, such as the relocation of affected communities or the implementation of pollution control measures (Sittadewi, 2019).
The PMP also utilizes visual tools to engage and empower communities in the decision-making process. Interactive maps and virtual reality simulations are used to educate community members about the potential risks and allow them to provide feedback on proposed interventions. This participatory approach ensures that the community’s perceptions and concerns are taken into account, leading to more sustainable and inclusive risk mitigation strategies (Kozłowska-Woszczycka & Pactwa, 2022).
The visual mapping approach is a powerful tool for effective risk mitigation in post-mining programs. It involves the use of matrix methods to identify, analyze, and communicate risks and initiative ESG strategies (Lokuwaduge & Heenetigala, 2017). By visually representing data and information, the community and stakeholders can better understand the potential risks and the effectiveness of proposed mitigation measures (Figure 3). Visual of social mapping risk also facilitates collaboration and decision-making by providing a common platform for communication and engagement (De Vreese et al., 2016).
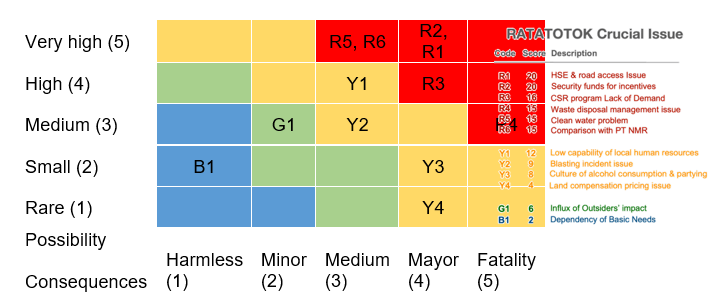
Figure 3. Matrix of Social Mapping Risk at Ratatotok District
Another challenge is the technical expertise required to use visual tools effectively. Not all stakeholders may have the necessary skills to interpret and analyze the data. To overcome this challenge, organizations can provide training and support to stakeholders, ensuring they have the knowledge and confidence to use the visual tools.
To effectively utilize visual tools in mitigating risks and maintaining social culture order, consider the following step activity (Kikuchi & Takahashi, 2022):
ESG Strategies and Community Development Program
Social perception plays a significant role in the success of post-mining programs. The way the community perceives the risks and benefits associated with mining operations can influence their level of engagement and cooperation (Ntema et al., 2017). De Vreese et al., (2016) explain that social perception is crucial for mining companies to understand the concerns, aspirations, and values of the community to develop effective risk mitigation strategies. By addressing the social perception of risks, such as health hazards and economic uncertainties, post-mining programs can build trust and ensure the acceptance and participation of the community (L. M. Fonseca et al., 2020). Implementing risk mitigation strategies in post-mining programs requires a systematic and collaborative approach. Key steps include (Ghorbanzadeh et al., 2019):
Based on the risk matrix analysis from social mapping, the proposed program can be proposed to mitigate the socio-economic conditions of the community in the Ratatotok area which is dominated by illegal mining activities. Then ESG initiation programs can be grouped into 5 pillars, namely: 1) Education and Healthcare, 2) Income Enhancement & Economic Empowerment, 3) Social and Cultural Development, 4) Infrastructure and Environmental Sustainability, and 5) Institutional Strengthening. This initiation program is based on the idea of preparing for the transfer of community dependence from illegal mining activities, so the orientation refers to the way of preparing post-mining programs, with the target of better empowerment and sustainability of life (Hasibuan et al., 2022).
Effective risk mitigation in post-mining programs has a significant impact on community development (Damopoli, 2013). By minimizing the negative impacts of mining operations and addressing the concerns of the community, these programs can foster sustainable livelihoods, improve access to education and healthcare, and enhance the overall well-being of the community (Triana et al., 2019). Additionally, successful social risk mapping efforts contribute to the social and economic stability of the region, attracting further investment and opportunities for growth.
Evaluating the effectiveness of social risk mitigation efforts is crucial to refine and improve post-mining programs. Implementing Environmental, Social, and Governance (ESG) approaches to tackle illegal gold mining in Indonesia faces several significant challenges:
Regulatory and Enforcement Issues
Socio-Economic Factors
Environmental and Health Impacts
Institutional and Capacity Challenges
Community Engagement and Awareness
In conclusion, social mapping is a powerful tool for visualizing economic risks, understanding their social impact, and designing effective mitigation strategies. By capturing and analyzing social data, stakeholders can gain valuable insights into the interconnectedness of economic risks, identify vulnerable areas, and mobilize resources more effectively. The benefits of social mapping extend beyond risk analysis, promoting transparency, inclusivity, and collaboration in economic risk management.
Social Risk Mapping has the potential to significantly contribute to the achievement and maintenance of social culture order. By providing a visual representation of social interactions and dynamics, Social Risk Mapping can help identify potential conflicts, communicate strategies, and promote collaboration. Social Risk Mapping is essential to consider the challenges and limitations of visual tools and ensure their accurate and inclusive use. By embracing Social Risk Mapping, we can navigate the complexities of social interaction and work towards a harmonious social culture order.
The successful implementation of social mapping for ESG strategies and program initiation requires a systematic approach, investment in capacity building, and regular monitoring and evaluation. With continued efforts, social mapping has the potential to transform the Indonesian mining industry, leading to more sustainable and inclusive practices.
Limitation