Business Professionals’ Digital Competence in the Fourth Industrial Revolution Era
Md. Abdullah Al Mahmud a, Mohammad Jamal Hossain b
aSchool of Business & Economics, Manarat International University, Bangladesh
bSchool of Business & Economics, Manarat International University, Bangladesh,
The Fourth Industrial Revolution instigates business professionals to adopt digital skills. The digital transformation of business organization is unfulfilled without the digital adaptation of business professionals. The future of job & skills will completely base on digitization. As the job nature is changing so it is obvious to evaluate the professionals’ adaptability in digital skills. This paper has investigated the business professionals’ digital adaptation rate. The paper has also revealed the barriers to digital adaptation. The study has observed 220 professionals’ response from divergent industries. Data were analyzed by SPSS and Excel. The analyses measured a various level of digital adaptation. Most of the respondents are competent in digital collaboration and social media engagement but pose lacking in IOT adaptation. The results indicate moderate adaptation among professionals. The hypothesis analysis showed low engagement of the organization and inadequate training are the main barriers to digital adaptation. High potential respondents are engaged with agile learning platform MOOCs. Among the MOOCs platform, LinkedIn learning is the widely used sources for enhancing skills. There are no significant differences in digital adaptation among various industry professionals. Responding with the change is the prime factor to become digitally savvy. The study has suggested leaders of the organization should play a dynamic role to meet the challenges of fourth industrial revolution. The paper poses some impetus for the researchers for digital transformation in the human resources field.
Keywords: Digital Adaptation, 4IR, Business Professionals’ Digital Competency, Future Skills.
Digital Competence is considered as the vital factor for competency measurement of the professionals. A growing number of researchers across the world conduct research on the topic digital competency. Growing technological disruption brings challenges to professionals for responding rapidly with the changes. The challenges are growing due to Fourth Industrial Revolution (4IR). The core components of fourth industrial revolution (4IR) are Internet of Things (IOT), Big Data analytics and Cyber security based cloud infrastructure. All these components are directly digital technology. As 4IR is bringing more challenges to business professionals so it is quite obvious to respond the challenges by developing digital competencies. This exploratory research focuses on answering the following pivotal research question: To what extent are Business Professionals’ digitally competent?
In general, digital competence implies knowledge, awareness and attitudes towards the values of ICT along with owning the ability to deal with the latest technologies and digital information (Ferrari, 2013) where users are entitled to create, to manipulate, to design, and to self-actualize. Such capability is linked to cognitive-thinking strategies in terms of utilizing digital information and achieving tasks in digital environments. Although, there are already a lot of frameworks and discourses around digital competence, such general theoretical frameworks will not be sufficient as the digital competence develops (Calvani, Fini, Ranieri, & Picci, 2012; Janssen et al., 2013; Littlejohn, Beetham, & McGill, 2012). Hence, more developed assessment tools to measure digital competence need to be developed. Moreover, prior studies claim that digital competence may impact individual’s performance with digital technology in informal learning environments (Meyers, Erickson, & Small, 2013; Ungerer, 2016). Digital competence has been stated as one of the essential competencies in the European framework for key competencies for lifelong learning (Rantala and Suoranta, 2008). Those key competencies identified by the European Parliament and of the Council (2006) include: (1) communication in the mother tongue, 2) communication in foreign languages, (3) mathematical competence and basic competences in science and technology, 4) digital competence, 5) learning to learn, (6) social and civic competences, 7) a sense of initiative and entrepreneurship, and 8) cultural awareness and expression. Digital competence is considered an essential component of the twenty first century (Ferrari, 2013). It involves skills which exceed searching for information online, and includes more demanding services and advanced expertise such as problem-solving, sharing and collaborating with peers (Griffin, McGraw, & Care, 2012).
The literature identifies several challenges to digital competency development, including rapid technology shifts, skill mismatches, and resistance to change. Additionally, the balance between developing technical and soft skills remains a significant challenge as businesses seek to foster both to achieve optimal digital transformation outcomes (Blizkiy et al., 2021), (Erceg & Zoranović, 2020).
A new framework for the development of digital competence was proposed in one of the European Commission reports (2013). The framework consists of five core areas: information processing, communication, content creation, problem solving, and safety.
Dig Comp framework (Ferrari, 2013)
Those five areas of digital competence have been developed into a self-assessment gird according to three proficiency levels: basic, intermediate and advanced.
Research Objectives
The research aimed to measure the digital competency of business professionals’ in Bangladesh. An additional objective is to develop the measurement of digital competency indicators using the principal-component factor analysis approach.
The Digital Competence framework for citizens (DigComp) has already been used in European contexts by several institutions and individuals. A standardized questionnaire was adopted and was later administered and managed via one of the online survey platforms, Google Form. The questionnaire was designed and tested by the European Union (Euro pass). This robust questionnaire was chosen because Ferrari (2013) states that the Digital Competence Framework for Citizens (DigComp) can support the improvement of digital skills of the European citizens as well as others located in different contexts. DigComp helps ‘organizations’, businesses and individuals to identify digital knowledge and the needs of digital culture that citizens have in their social and personal life’ (Vuorikari et al., 2016). DigComp is a 19-item screening instrument, including three scales (basic, intermediate and advanced) and five main categories that appraises Information Processing (3 items), Communication (4 items), Content Creation (4 items), Safety (4 items) and Problem Solving (4 items). Participants were asked to choose from the list. Participants were 220 Business Professionals among whom 123 were male and 97 were female. They were selected through a technique known as of purposive sampling. In purposive sampling, the researcher selects people who are keen to provide the appropriate information from their own experience and knowledge regarding the domain or issue under investigation (Bernard, 2002). The analysis was performed through survey components analyzed using the SPSS 25 for Windows software.
Cronbach’s Alpha: Reliability and Internal Consistency
The reliability of any given measurement depends on the extent to which it is a consistent measure of a concept, and Cronbach’s alpha is one way of measuring the strength of internal consistency. The resulting coefficient of reliability ranges from 0 to 1 when providing this overall assessment of a measure’s reliability. If all of the scale items are entirely independent from one another (i.e., are not correlated or share no covariance), then the alpha =0; on the contrary, if all of the items have high covariance’s, then alpha will approach 1 as the number of items in the scale approaches infinity. The higher the alpha coefficients; the more the items have shared covariance and probably measure the same underlying concept. In this research, the Cronbach’s alpha coefficient of 0.898 is clearly acceptable, suggesting that the items have a relatively high internal consistency, as shown in table below (Note that a reliability coefficient of 0.7 or higher is considered ‘acceptable’ in most social science research and humanities-related studies). This would indicate strong inter correlations (inter-connections) among test items.
Output of reliability test items (Cronbach alpha)
| Item-Total Statistics | |||||
| Scale Mean if Item Deleted | Scale Variance if Item Deleted | Corrected Item-Total Correlation | Squared Multiple Correlation | Cronbach’s Alpha if Item Deleted | |
| IP1 | 34.7682 | 59.576 | .529 | .567 | .893 |
| IP2 | 34.9682 | 63.045 | .198 | .223 | .903 |
| IP3 | 34.7364 | 61.537 | .309 | .446 | .900 |
| Communication1 | 34.5227 | 60.406 | .431 | .444 | .896 |
| Communication2 | 34.9136 | 63.851 | .111 | .171 | .907 |
| Communication3 | 34.6773 | 59.946 | .500 | .572 | .894 |
| Communication4 | 34.7636 | 60.346 | .455 | .524 | .895 |
| Content_Creation1 | 35.1727 | 59.650 | .543 | .531 | .893 |
| Content_Creation2 | 34.7500 | 57.850 | .734 | .652 | .887 |
| Content_Creation3 | 35.0318 | 58.579 | .748 | .729 | .888 |
| Content_Creation4 | 35.0409 | 58.176 | .663 | .550 | .889 |
| Safety1 | 34.9864 | 58.306 | .683 | .648 | .889 |
| Safety2 | 34.9545 | 59.888 | .476 | .472 | .895 |
| Safety3 | 34.8545 | 58.134 | .683 | .628 | .889 |
| Safety4 | 34.8682 | 57.658 | .785 | .714 | .886 |
| PS1 | 34.9545 | 58.838 | .594 | .532 | .891 |
| PS2 | 34.9500 | 58.632 | .610 | .579 | .891 |
| PS3 | 34.9364 | 58.197 | .679 | .561 | .889 |
| PS4 | 34.9591 | 58.770 | .604 | .575 | .891 |
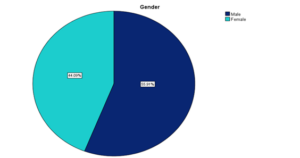
The study has observed 220 respondents. Out of which 55.9% respondents are male and remaining 44.1% are female. The majority of the respondents 70% have completed their post-graduation, the remaining 30 % of the respondents have completed their graduation.
The majority of respondents surveyed (65%) report that they are under pressure to develop additional skills to succeed in their current and future jobs.
Are you getting pressure to develop additional skills to succeed in your current & future job?
| Frequency | Percent | Valid Percent | Cumulative Percent | ||
| Valid | Yes | 143 | 65.0 | 65.0 | 65.0 |
| No | 77 | 35.0 | 35.0 | 100.0 | |
| Total | 220 | 100.0 | 100.0 | ||
The analysis revealed that the business professionals vary considerably in their level of digital competence. Overall 33.18 % of the surveyed business professionals are basic users, 47.27 % are intermediate users and the remaining 19.5% are advanced users.
The statistical analysis showed that most of the categories belong to intermediate level; it implies that majority of the respondent’s information processing, content creation and safety related competencies are intermediate level. On the contrary, most participants were discovered to possess a basic level of competence when it came to solving problems related to technical support. It is noticeable that business professionals were found to be advanced in the use of a range of communication tools such e-mail, instant messaging, blogs, and other common social networks such as Twitter and Facebook. However, the respondents were discovered to have a basic level of competence with regard to the problem solving tools.
Polychoric Correlation and Matrix
Polychoric correlation is a statistical test used to measure the correlation coefficient (association) between two ordinal variables. The variables are scored from a number of multiple-choice questions. The purpose of polychoric correlation is to reduce the effect of statistical artifact and sets an assumption of an underlying joint continuous distribution. The coefficient is between 0 and 1 where zero does not indicate any relationship and one signifying perfect relationship. As indicated in the following table, all the variables which achieved polychoric correlation were indicated with bold. This means a strong agreement between various test items. Those test items have achieved what is so-called polychoric correlation at various levels. For instance, there is a correlation coefficient with a level of > (0.45) and higher of two normally distributed variables such as content creation 3 and problem solving 4 (0.68).
Pearson, Polyserial, and Polychoric Correlationsa
| Variables | Variables | |||||||||||||||||||
| IP1 | IP2 | IP3 | Communication1 | Communication2 | Communication3 | Communication4 | Content_Creation1 | Content_Creation2 | Content_Creation3 | Content_Creation4 | Safety1 | Safety2 | Safety3 | Safety4 | PS1 | PS2 | PS3 | PS4 | ||
| IP1 | 1.00 | |||||||||||||||||||
| IP2 | 0.36 | 1.00 | ||||||||||||||||||
| IP3 | 0.49 | 0.40 | 1.00 | |||||||||||||||||
| Communication1 | 0.49 | 0.20 | 0.38 | 1.00 | ||||||||||||||||
| Communication2 | 0.23 | 0.22 | 0.26 | 0.07 | 1.00 | |||||||||||||||
| Communication3 | 0.66 | 0.37 | 0.45 | 0.53 | 0.19 | 1.00 | ||||||||||||||
| Communication4 | 0.57 | 0.34 | 0.51 | 0.53 | 0.20 | 0.60 | 1.00 | |||||||||||||
| Content_Creation1 | 0.18 | -0.01 | -0.11 | 0.13 | -0.06 | 0.14 | 0.09 | 1.00 | ||||||||||||
| Content_Creation2 | 0.26 | 0.13 | 0.18 | 0.27 | 0.11 | 0.24 | 0.29 | 0.52 | 1.00 | |||||||||||
| Content_Creation3 | 0.30 | 0.04 | 0.07 | 0.25 | -0.02 | 0.27 | 0.19 | 0.59 | 0.66 | 1.00 | ||||||||||
| Content_Creation4 | 0.30 | 0.05 | 0.09 | 0.26 | -0.04 | 0.28 | 0.24 | 0.48 | 0.54 | 0.66 | 1.00 | |||||||||
| Safety1 | 0.28 | -0.01 | 0.05 | 0.24 | 0.01 | 0.23 | 0.22 | 0.63 | 0.58 | 0.71 | 0.57 | 1.00 | ||||||||
| Safety2 | 0.07 | 0.12 | 0.20 | 0.04 | 0.14 | 0.10 | 0.09 | 0.28 | 0.57 | 0.47 | 0.39 | 0.33 | 1.00 | |||||||
| Safety3 | 0.27 | 0.01 | 0.08 | 0.17 | 0.03 | 0.17 | 0.17 | 0.55 | 0.67 | 0.64 | 0.57 | 0.62 | 0.43 | 1.00 | ||||||
| Safety4 | 0.35 | 0.10 | 0.18 | 0.28 | 0.07 | 0.29 | 0.28 | 0.53 | 0.69 | 0.70 | 0.57 | 0.68 | 0.54 | 0.71 | 1.00 | |||||
| PS1 | 0.26 | -0.04 | 0.00 | 0.33 | -0.11 | 0.26 | 0.18 | 0.51 | 0.52 | 0.61 | 0.58 | 0.51 | 0.27 | 0.52 | 0.53 | 1.00 | ||||
| PS2 | 0.22 | -0.07 | -0.01 | 0.22 | -0.10 | 0.17 | 0.11 | 0.58 | 0.54 | 0.62 | 0.59 | 0.62 | 0.36 | 0.60 | 0.60 | 0.59 | 1.00 | |||
| PS3 | 0.31 | 0.11 | 0.17 | 0.26 | 0.05 | 0.25 | 0.22 | 0.51 | 0.59 | 0.68 | 0.55 | 0.63 | 0.37 | 0.56 | 0.65 | 0.46 | 0.51 | 1.00 | ||
| PS4 | 0.19 | -0.05 | 0.02 | 0.07 | 0.06 | 0.18 | 0.07 | 0.53 | 0.53 | 0.68 | 0.52 | 0.55 | 0.46 | 0.59 | 0.62 | 0.51 | 0.56 | 0.50 | 1.00 | |
Factor Analysis is a statistical method used to describe variability among different variables for the purpose of reducing data and to concentrate on variation of a large number of observed variables into far fewer aggregated dimensions. Eigenvalue reflects the number of extracted factors whose sum should be equql to the number of test items which are subjected to factor analysis. The Eigenvalue is calculated for each factor extracted. If the Eigenvalue drops below 1, it means that the factor explains less variance than adding a variable would do. Accordingly, the findings showed the choice of 3 factors (eigenvalue >=1). These factors explains 62.97% of the variance. The first factor accounts for 37.38% of the variance, the second 17.32% and the third 8.27%. All the remaining factors are not statistically significant. After extracting the factors; the oblique rotation was used to ensure that the factors are orthogonal and better fit with the data.
The results of the principal component factor analysis are given respectively starting with IP1 to PS4 as shown in the following table. Each principal component explains a linear combination of group of interrelated variables which make the greatest contribution to the factor (or latent variable). The first three axis, or variables which each one was significantly found as a combination of a number of other variables which were also highly correlated, are as follows:
Factor 1: CC1, CC2, CC3, CC4, S1, S3, S4, PS1, PS2, PS3, PS4.
Factor 2: IP1, IP2, IP3, CM1, CM3, CM4
Factor 3: CM2, S2
These factors can be used as variables for further analysis.
KMO Test: It tests the suitability of factor analysis. Values closer to 1 is better. In this case the KMO Sampling adequacy value is .930. So it passes the suitability.
KMO and Bartlett’s Test
| Kaiser-Meyer-Olkin Measure of Sampling Adequacy. | .930 | |
| Bartlett’s Test of Sphericity | Approx. Chi-Square | 2335.897 |
| df | 171 | |
| Sig. | .000 | |
| Component Matrixa | |||
| Component | |||
| 1 | 2 | 3 | |
| IP1 | .643 | ||
| IP2 | .510 | ||
| IP3 | .713 | ||
| Communication1 | .556 | ||
| Communication2 | .555 | ||
| Communication3 | .685 | ||
| Communication4 | .711 | ||
| Content_Creation1 | .687 | ||
| Content_Creation2 | .799 | ||
| Content_Creation3 | .853 | ||
| Content_Creation4 | .759 | ||
| Safety1 | .795 | ||
| Safety2 | .582 | ||
| Safety3 | .790 | ||
| Safety4 | .853 | ||
| PS1 | .709 | ||
| PS2 | .747 | ||
| PS3 | .761 | ||
| PS4 | .724 | ||
| Extraction Method: Principal Component Analysis. | |||
| a. 3 components extracted. | |||
Validation of Instruments
The confirmatory factor analysis (CFA) was conducted to confirm and refine the factor structure of the digital competence scale. In this study, CFA was used to test the second order three-factor model of digital competence scale, and the first order of sub-scale model fit. A variety of fit indices were used to test the model fit. An adequate model fit is represented by GFI, AGFI and CFI values that are greater than 0.90 (Hoyle, 1995), and a RMSEA value below 0.05 is good and below 0.08 is acceptable (Byrne, 2001). Following table shows the results of CFA for all sub-scales and the overall digital competence scale. After removing some items and modifying the model to improve the model fit according to the modification indices, the overall results showed a satisfactory fit to the data. These results indicated that our multi-dimensional digital competence scale model has a good fit to the sample test. The results of the CFA were then used to test the construct validity of the research latent variables and harmony correlation was found of the empirical data contained in this research model (c 2 (142)=291.721, X 2 /df=2.054; CFI=.933; RMSEA=.069 ; GFI = 0.862; AGFI = 0.816; AIC=387.721).
To assess the reliability of the scale, Cronbach’s Alpha was computed, all sub-scales Cronbach’s scores are greater than 0.7 which shows each of digital competence sub-scales have a good internal consistency reliability.
CMIN
| Model | NPAR | CMIN | DF | P | CMIN/DF |
| Default model | 48 | 291.721 | 142 | .000 | 2.054 |
| Saturated model | 190 | .000 | 0 | ||
| Independence model | 19 | 2414.924 | 171 | .000 | 14.122 |
RMR, GFI
| Model | RMR | GFI | AGFI | PGFI |
| Default model | .035 | .862 | .816 | .645 |
| Saturated model | .000 | 1.000 | ||
| Independence model | .186 | .260 | .177 | .234 |
Baseline Comparisons
| Model | NFI Delta1 |
RFI rho1 |
IFI Delta2 |
TLI rho2 |
CFI |
| Default model | .879 | .855 | .934 | .920 | .933 |
| Saturated model | 1.000 | 1.000 | 1.000 | ||
| Independence model | .000 | .000 | .000 | .000 | .000 |
RMSEA
| Model | RMSEA | LO 90 | HI 90 | PCLOSE |
| Default model | .069 | .058 | .081 | .003 |
| Independence model | .245 | .236 | .253 | .000 |
Digital competence is associated with three knowledge areas which must be integrated: technology proficiency, pedagogical compatibility and social awareness (Zhao et al., 2002). Instefjord and Munthe (2016) confirm that digital competence is based on the knowledge areas suggested by Zhao et al. (2002). In view of that, technology proficiency depends on professionals’ technical competence and confidence in terms of employing technology. Finally social awareness refers to users’ ability to deal with various social aspects of the school or class culture (Instefjord & Munthe, 2016). Therefore, it was not surprising that a number of business professionals were found not to be advanced in terms of their digital competence due to ‘inexperience, lack of training, lack of prior knowledge, or just being poor performing individuals’ (Maderick et al., 2016, p. 343)..
As demonstrated above, nearly an equal proportion of responses were provided by males and females, which would indicate less biased findings. Furthermore, most business professionals who revealed their level of digital competence and their needs had from five to ten years of experience. The findings show that despite the fact that the majority of the respondents had IT related certificates; they assessed themselves as less competent in several aspects of digital competence. Nevertheless, this does not necessarily mean that other professionals with more or less years of teaching experience are uniquely different. The statistical analysis also showed a strong correlation (with a score of 0.68) between the ability to edit the content produced by others such as adding and deleting and the ability to increase awareness of the users’ private information and credentials e.g., username and password.
This study has examined digital competency and proficiency of Business Professionals. Overall, there were few problems in terms of scale consistency when looking at a representative sample of the population. The reliability and validity of the scales were good. All correlations were in the same direction and significant. More qualitative studies, or studies with more subjects in all age and occupational groups, might reveal the meaning of the observed differences. Furthermore, it is not yet possible for us to conclude whether the observed differences would also occur in population surveys in other countries.
The business professionals who took part in this research were identified as moderate digitally competent as they are expected to be. Further digital-related competencies should be promoted to business professionals as part of continuous professional development (CPD). The study has revealed that most of the organizations are not offering adequate training programs for their employees. This leads personal investment for high potentials. High potentials in various organizations keep themselves up-to-date by engaging learning in Massive Open Online Courses (MOOCs) platforms. MOOCs are just one way to support individuals’ digital competence and encourage their unlimited participation on the web. The study has suggested leaders of the organization should play a dynamic role to meet the challenges of fourth industrial revolution.
Further research should be carried out to investigate Business Professionals’ digital competence qualitatively to get further answers regarding the challenges that hinder and demotivate professionals from integrating technology in business organization. It would also be interesting to ask such business professionals how they can become more digitally competent. The current research focused on determining the business professionals’ digital competence as individuals, rather than in groups or during social interaction. Thus, measuring and assessing business professionals in those situations could be considered in other studies.