Correlation Between the Flow Rate and the 85th Percentile Operating Speed: The Insight of Empirical Traffic Studies at Jalan Kapar to Kuala Selangor
Muhammad Syazani Ngadanan1, Muhammad Akram Adnan2,Tuan Badrol Hisham Tuan Besar 3*
1,,3School of Civil Engineering, College of Engineering, Universiti Teknologi MARA, Shah Alam, Selangor, Malaysia
34Departmetn of Technology and Supply Chain Management, Faculty of Business Management,UiTM Puncak Alam, Malaysia
This study was conducted to investigate the 85th percentile operating speed with the flow rate when approaching the school bridge of heavy vehicle. The site survey for this roadway is located at Jalan Kapar-Kuala Selangor, Selangor at SK Jeram Batu 20 school which is a multilane highways and road design standard is R5. Site condition in this area is flat terrain. Laser meter detector was used to collect the spot speed data of the Class 3 which heavy vehicles. Linear regression and paired t-test analysis was employed using Minitab statistical software to identify difference the 85th percentile operating speed versus the flow rate in Lane 1 and Lane 2. The results revealed that there is significant difference in the heavy vehicle speed in Lane regression model (Equation 1), was 58.40 km/h, which falls below the design speed for Jalan Kapar-Kuala Selangor (R5). Similarly, in Lane 2, the average speed was 73.60 km/h, exceeding the recommended speed limit. This indicates that investigate the correlation between the flow rate and the 85th percentile speed of heavy vehicles of two lanes when approaching the school bridge.
Keywords: 85th percentile speed, heavy vehicles, multilane highways, flow rate.
Highway geometry significantly influences a highway’s safety and efficiency. This encompasses careful design of the road’s physical characteristics, including width, curves, and slopes. Key considerations include sight distance, alignment, and superelevation. Anticipating future traffic growth during the initial design phase is crucial to prevent future accidents. Importantly, variations in vehicle speed often indicate inconsistencies in the road’s geometric design (Nicholson, 1998).
Speed is a fundamental parameter in highway geometric design. Operating speed, defined as the speed drivers select when not restricted by others (Poe et al., 1996), typically corresponds to the 85th percentile speed. This operating speed is a key indicator of geometric design consistency. In Malaysia, design speed selection adheres to the ATJ 8/86 standards, considering both rural and urban contexts.
A multilane highway features two or more lanes for traffic in each direction, either divided or undivided. In Malaysia, both types are prevalent. Divided highways are separated by a median, which can be a rigid barrier, a flexible barrier, or a landscaped area (Highway Capacity Manual, 2011). A “multilane highway in rural” specifically refers to such a road located in a sparsely populated area. Semeida (2012) highlights the significant influence of lane width, heavy vehicle percentage, and accessibility on lane capacity at tangent sections of open-access multilane rural roads in Egypt.
This study focuses on the flow rate of heavy vehicles between two lanes (lane 1 and lane 2) approaching a school bridge. The primary objective is to investigate the correlation between the flow rate of heavy vehicles and their 85th percentile speed on these two lanes while approaching the bridge.
Current knowledge regarding the relationship between heavy vehicle flow rate and speed, particularly in the vicinity of critical infrastructure such as school bridges, remains limited. Previous research by Hashim and Bird (2005) suggests that approximately 50 spot speed observations at each site in each direction should suffice for estimating operating speed at a given location.
A critical gap exists in data-driven insights that could inform the establishment of appropriate speed limits and the implementation of safety enhancements for heavy vehicles operating near school zones. In the present study, the road design standard is R5, with a design speed of 100 km/h for flat terrain. Based on this standard, the posted speed limit should be 90 km/h. However, the observed posted speed limit is 60 km/h, indicating a discrepancy with the current road design standard (R5).
The interplay between heavy vehicle flow and speed near school bridges presents a potential for traffic congestion and safety hazards.
The objective of the present study is to evaluate the flow rate of heavy vehicles between two lanes when approaching the school bridge through empirical data. Besides that, to determine the 85th percentile speed of heavy vehicles when approaching the school bridge and to investigate the correlation between the flow rate and the 85th percentile speed of heavy vehicles of two lanes when approaching the school bridge.
Data collection was conducted at the SK Jeram Batu 20 school bridge in Jeram, Selangor, during daytime hours. Two observation sessions were carried out: the first from 9:00 AM to 11:00 AM, and the second from 12:45 PM to 2:45 PM. At each location, spot speed data and traffic counts were collected for 120 minutes (two hours).
Two locations were observed at the school bridge. The first location, situated near SK Jeram Batu 20, monitored traffic approaching from Kapar towards Kuala Selangor. The second location, at the same bridge, monitored traffic approaching from Kuala Selangor towards Kapar. Two laser speed detectors were employed to capture spot speed data. One device was used to measure approaching speeds, while the other measured departing speeds. During the first session, both detectors were used to measure approaching and departing speeds from Kapar towards Kuala Selangor of heavy vehicles.
Research Process
The research process to evaluate the different to evaluate the difference of the flow rate and the 85th percentile speed of lane 1 and lane 2 approaching the school bridge of heavy vehicles in Figure 1.
![]()
Figure 1: Research Process Flowchart
Speed Terminology
Speed is a fundamental parameter in assessing traffic performance on road systems. It is defined as the rate at which a vehicle covers a distance within a given time frame. Speed terminology is explained in Table 1.
Table 1: Speed Terminology
| Type of Speed | Description of Terminology |
| Operating Speed | Operating speed represents the maximum sustainable speed a driver can maintain on a given road segment under ideal weather and traffic conditions, ensuring they never exceed the design speed for any specific section. Arahan Teknik (Jalan) ATJ 8/86 (2015). |
| Design Speed | Design speed signifies the highest safe speed that can be consistently maintained over a particular road section under optimal conditions, where the road’s design features dictate the speed limit. The chosen design speed should be realistic, considering factors like topography, surrounding land use, and the road’s purpose. While prioritizing safety, mobility, and efficiency, the design speed should be as high as reasonably feasible. Arahan Teknik (Jalan) ATJ 8/86 (2015). |
| 85th percentile speed | The 85th percentile speedN represents the speed at which 85% of observed vehicles travel on a specific road segment. This speed typically reflects the “pace” or preferred speed range adopted by the majority of drivers at that particular location or for those specific road geometries (AASHTO Green Book, 2011) |
Design Speed Criteria
Before determining the design standards for a specific road location, an assessment of the existing geometric conditions is crucial. Design speed represents the maximum safe speed that a vehicle can maintain over a particular road section under ideal conditions, where the road’s geometric features (such as curves and slopes) primarily dictate the speed limit.
Table 2: Design Speed (Rural)
| Design Standard | Design Speed (km/hr) | ||
| Terrain | |||
| Flat | Rolling | Mountainous | |
| R6 | 120 | 100 | 80 |
| R5 | 100 | 80 | 60 |
| R4 | 90 | 70 | 60 |
| R3 | 70 | 60 | 50 |
| R2 | 60 | 50 | 40 |
| R1 | 40 | 30 | 20 |
Location
This study was carried out on Jalan Kapar-Kuala Selangor, a multilane highway located in Selangor, Malaysia.The road adheres to the R5 design standard locations. All three study sites are situated in flat terrain. The locations of the study sites are depicted in Figure 2. Actual photographs of the study sites are presented in Figures 3, 4, and 5.
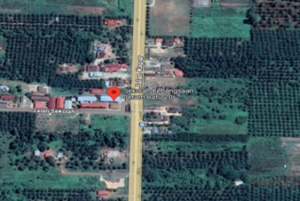
Figure 2: Location at The School Bridge SK Jeram Batu 20
Instrumentation
Spot speed data were collected using a laser speed detector (Figure 3). This device employs advanced technology that utilizes invisible light waves with high frequencies to accurately measure vehicle speed and distance. By emitting infrared light and measuring the time taken for the reflected signal to return, the detector calculates the distance to the target vehicle. A sophisticated algorithm then processes these distance measurements to determine the vehicle’s speed, which is subsequently displayed on the device. Both speed and distance data were recorded for subsequent analysis.
Traffic volume data, categorized by vehicle class, were collected using a traffic counter (Figure 4). Vehicle classes were classified as 1, 2, 3, 4, and 5, following the classification system outlined in the Highway Capacity Manual (2011). Geometric features such as lane width, median width, and shoulder width were measured using a roller meter (Figure 5).
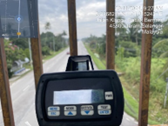
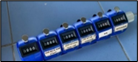
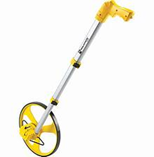
Figure 3: Laser meter detector Figure 4: Traffic counter Figure 5: Roller meter
Data collection
Data collection for this study was conducted at a specific location: the school bridge at SK Jeram Batu 20, Jeram. This location was chosen as the focus area for this research. Speed data and traffic counts were collected at five-minute intervals for a duration of 120 minutes at the study location from Kapar to Kuala Selangor and the other 120 minutes from Kuala Selangor to Kapar.
Abbreviation and Acronym of Empirical Data Analysis
Abbreviations and acronyms need to be well-deliberated and addressed in data analysis. This is because the data need to have a clear understanding to the readers and give an ample indicator for further references. Table 3 shows the abbreviations and acronyms used for the data analysis.
Table 3: Abbreviations and acronyms of empirical data analysis
| V 85 | 85th percentile speed (km/hr) |
Relationship between V85 and flow rate by lanes
Flow rate is defined as the equivalent hourly rate of heavy vehicle passage at a specific point or section of a multilane highway, particularly at the school bridge, within a designated time period. Based on empirical data collected at the study site, the relationship between 85th percentile speed (V85) and flow rate were analyzed for both lane 1 and lane 2. Figure 6 demonstrates an inverse relationship between V85 percentile speed of heavy vehicles and flow rate in lane 1, indicating that V85 decreases as flow rate increases. Conversely, Figure 7 illustrates a positive correlation between V85 percentile speed of heavy vehicles and flow rate in lane 2, suggesting that V85 increases with increasing flow rate.
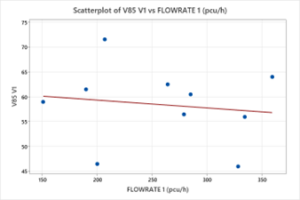
Figure 6: V85 (V1) Lane 1 vs Flow Rate Lane 1
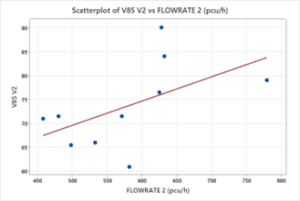
Figure 7: V85 (V2) Lane 2 vs Flow Rate Lane 2
Linear Regression Analysis
Linear regression analysis is a predictive statistical method used to model the relationship between two variables by fitting a linear equation to observed data. In this study, the two variables analyzed were 85th percentile speed and flow rate. Equations 1, 2, and 3 present the linear regression models developed for this study.
Equation 1 represents the linear regression model for V85 in Lane 1. The negative coefficient associated with the flow rate predictor variable in this equation indicates an inverse relationship. This implies that an increase in the flow rate of heavy vehicles in Lane 1 will likely lead to a decrease in the 85th percentile speed of vehicles in that lane.”
V85 = 62.5 – 0.0158 flow rate (R2=0.0204) (1)
Table 4 reveals that the relationship between the inverse square root of flow rate and V85 in Lane 1 is statistically insignificant, as indicated by a p-value exceeding 0.05. This finding suggests that the flow rate, in this specific form, does not significantly influence V85 in Lane 1. Based on the linear regression equation, the average V85 in Lane 1 is determined to be 58.40 km/hr.
Table 4: Regression Analysis for the final model for estimating V85 for Lane 1
| Term | Coefficient | Standard Error | T-Value | P-Value |
| Constant | 62.5 | 10.4 | 6.03 | 0.000 |
| Flow rate (Pcu/hr) | -0.0158 | 0.0387 | -0.41 | 0.694 |
Equation 2 presents the linear regression model for V85 in Lane 2. The positive coefficient associated with the flow rate predictor variable in this equation signifies a direct relationship. This implies that an increase in the flow rate of heavy vehicles in Lane 2 is likely to result in an increase in the 85th percentile speed of vehicles within that lane.
V85 = 44.3 + 0.0506 flow rate (R2=0.2896) (2)
Table 5 reveals that the inverse square root of flow rate exhibits no significant correlation with V85 in Lane 2, as indicated by a p-value exceeding 0.05. This suggests that the flow rate in Lane 2 is not a significant predictor of V85 in this case. Based on the linear regression equation, the average V85 at Lane 2 is determined to be 73.60 km/hr.
Table 5: Regression Analysis for the final model for estimating V85 for Lane 2
| Term | Coefficient | Standard Error | T-Value | P-Value |
| Constant | 44.3 | 16.4 | 2.70 | 0.027 |
| Flow rate (Pcu/hr) | 0.0506 | 0.0280 | 1.81 | 0.109 |
Paired T-Test Analysis
A paired sample t-test was conducted on the different of lanes to determine whether there is statistically significant mean difference in the V85 and flow rate. The results, presented in Table 6, revealed a statistically significant mean difference between the lanes which p is less than 0.05. This finding suggests that lane characteristics significantly influence vehicle speeds.
Table 6: Paired T-Test Analysis
| Sample | N | Mean | Standard Deviation | SE Mean |
T- Value |
P-Value |
| Lane 1 | 10 | 58.4 | 7.74 | 2.45 | -3.92 | 0.003 |
| Lane 2 | 10 | 73.6 | 8.90 | 2.81 | -3.92 | 0.003 |
Regression analysis revealed no significant correlation between flow rate and 85th percentile speed in either lane. This suggests that lane characteristics influence vehicle speeds. The average speed in Lane 1, calculated from the regression model (Equation 1), was 58.40 km/h, which falls below the design speed for Jalan Kapar-Kuala Selangor (R5). Similarly, in Lane 2, the average speed was 73.60 km/h, exceeding the recommended speed limit of 60 km/h near the school and falling short of the R5 design speed of 90 km/h. Furthermore, the analysis indicated a relatively low volume of heavy vehicles, minimizing their impact on speed. These findings highlight the importance of a thorough understanding of design speed concepts, particularly on multilane highways.
A paired t-test was conducted to assess the statistical significance of the differences between the model-predicted results and the actual field measurements. As noted by Mr. Vikash Kumar (2016), a paired t-test evaluates the mean difference between paired observations. A negative value in this context indicates a decrease in the observed value compared to the model prediction. This analysis aimed to evaluate the model’s accuracy in predicting real-world conditions.
Based on site observations and study findings, several recommendations are proposed. Firstly, the installation of appropriate speed limit signage near the school area is crucial. While the current speed limit of 90 km/h adheres to the R5 refer to the ATJ 8/86 (2015) design standard, a more stringent speed limit should be enforced within the school vicinity. This will alert drivers to the need for reduced speeds. Secondly, implementing rumble strips approaching SK Jeram Batu 20 can effectively reduce vehicle speeds. For Lane 1, road repairs are necessary to address the presence of numerous patches that contribute to uneven road surfaces and encourage drivers to avoid the lane and prefer for the Lane 2 especially for heavy vehicles. To enhance data accuracy, it is recommended to extend data collection periods, potentially to a full day, to capture a more comprehensive dataset. Finally, the installation of signage specifically directing heavy vehicles to remain in Lane 1 can help mitigate speeding behavior near the school hence the road safety will be secured.
The findings of this study provide valuable insights that can be effectively integrated into current Malaysian guidelines and standards for highway design and operation. To enhance road user safety and mitigate risks such as vehicle loss of control and head-on collisions, several recommendations should be carefully considered.