Determinants Of Rice Farmers’ Membership In Agricultural Cooperatives In The Noun Department Of Cameroon
Abdoulay NSANGOU NJANKOUO 1* , Zenabou TOURERE 2 , Aboubakar NKOUANDOU 3 , Brice Hermann SIMO 4 , Zoulehatou MBOUESIE NJOYA 5
1 Dschang Multipurpose Agricultural Research Station, Agricultural Research Institute For Development
2Department Of Public Economics, Faculty Of Economics And Management, University Of Douala, Cameroon
3 Department Of Computer Science, Faculty Of Science, University Of Yaoundé I, Cameroon
National Institute Of Cartography Of Cameroon
4 Institute Of Agricultural Research For Development (IRAD, Yaoundé, Cameroon
5 Department Of Rural Socio-Economics And Agricultural Extension, Faculty Of Agronomy And Agricultural Sciences, University Of Dschang, Cameroon
This research examines the factors that determine the adhesion of rice farmers to agricultural cooperatives in the Noun department. The survey was conducted among 72 rice farmers distributed in the districts of Koutaba and Bangourain . The results show that rice farming is mainly practiced by men (63.89%), members of cooperatives (83.3%), with a low level of education (primary level, 72.2%), on plots with an average area of 1.57 ha, located at an average distance of 3.19 km from households. The analysis of the logistic regression model reveals that factors such as the age of the producer, group sales, access to extension services, gender, level of education, land ownership, and group purchasing positively influence adhesion to cooperatives. On the other hand, the cultivated area, yield, and number of years of experience negatively impact this adhesion.
Keywords : Determinant, Membership, Agricultural cooperative, rice cultivation, Noun Division, Cameroon.
Rice farming plays a crucial economic role in many developing countries, particularly in sub-Saharan Africa (Kamga, 2020). It represents a source of income for millions of small-scale rural producers ( Mendo , 2019) and contributes significantly to food security and the local economy ( Fongang , 2020). However, these producers face challenges such as low productivity, increased competition, and difficulties accessing markets ( Ngouhouo , 2019). Rice consumption is increasing faster than that of any other staple food in Africa, with an annual growth rate of about 5.5% (Kamga, 2020). This increase is due to urbanization, changing dietary habits, and population growth ( Macauley & Tabo , 2015). Rice is the staple food for more than 3.5 billion people worldwide, with annual per capita consumption exceeding 100 kg in many Asian countries and some African countries ( Folefack , 2014). It is primarily a smallholder crop, grown on farms, most of which are between 0.5 and 3 ha in size in these two regions (FAO, 2016).
In Cameroon, rice farming is an important activity in the Noun department, where it is practiced by thousands of producers ( Njouenque , 2018). Research by Ngouhouo (2019) revealed that rice farmers in this region face specific challenges, such as poor road infrastructure, difficulties in accessing inputs and credit, as well as competition from imports.
This foodstuff is among the most consumed products in Cameroon, with an average consumption of around 11,180 FCFA per capita per year in urban areas ( Deudjui , 2015). Thus, between 2015 and 2018, the country’s rice imports amounted to 652.6 billion FCFA, or an average of 163 billion per year. However, domestic demand for rice is estimated at 576,949 tonnes, for an average national production estimated at 140,710 tonnes, representing a deficit of 436,239 tonnes ( Andzongo , 2020).
The country has considerable untapped potential for rice production, as well as growing demand at both national and sub-regional levels (FAO, 2017). The rice sector, through producer organizations and economic partnerships with various public and private projects and programs, currently covers 18,420 hectares of irrigated areas (13,820 hectares in the SEMRY area in the Far North, 2,900 hectares for UNVDA in the Northwest, 200 hectares in the West and 1,500 hectares of small traditional areas) and approximately 22,000 hectares of insufficiently inventoried plateaus and lowlands ( Mbaw plains , Mont Mbapit , Ntui , Ebolowa, Akwaya , Tonga- Makénéné , etc.) (SNDR, 2009). Rice farming employs approximately 98,000 households, mainly women and youth for paddy production activities (C2D-RIZ Project / IRAD, 2013). Demand is managed by a limited number of operators (buyers, exporters, processors) who control the price-setting mechanisms ( Achancho , 2012). According to FAO (2012), the membership of producers in agricultural cooperatives would help overcome market failures (coordination of decisions, information sharing, reduction of transaction costs, economies of scale, increased bargaining power) and promote the integration of family farms into the market through risk sharing between individual producers within their organization, thus facilitating access to productive resources such as know-how, information, credit and capital.
Agricultural cooperatives were established to provide a support and development framework for rice farmers, offering them services such as training, credit, inputs and marketing ( Njouenque , 2018). However, the factors influencing rice farmers’ membership in cooperatives remain little studied in the Cameroonian context ( Fongang , 2020).
According to the Ministry of Agriculture and Rural Development (MINADER), agricultural cooperatives can play a key role in promoting rice farming in Cameroon by improving the productivity, quality, and competitiveness of rice products (MINADER, 2020). However, they face challenges such as low member participation, inadequate management, and a lack of funding ( Ngouhouo , 2019).
Previous studies have shown that membership in agricultural cooperatives can have a positive impact on rice production, by increasing rice farmers’ incomes and improving their access to markets ( Njouenque , 2018; Kamga, 2020). However, these studies did not specifically examine the factors influencing rice farmers’ membership in cooperatives in the Noun department.
This study aims to fill this gap by examining the factors influencing rice farmers’ membership in agricultural cooperatives in the Noun department. The results of this research could contribute to improving rice development strategies in Cameroon and strengthening the capacities of agricultural cooperatives to support rice farmers.
Study area and data collection
The study was conducted in the districts of Bangourain and Koutaba , located in the Noun department, West region of Cameroon. These areas were selected because they are among the main rice production basins in Cameroon, although the percentage of production is not fully inventoried (SNDR, 2009). They are also included in the intervention area of Phase II of the Mount Mbappit Rural Development Project and constitute key rice production areas. The Mount Mbappit Rural Development Programme II (PDRM-II) has carried out major lowland development works in these regions, enabling many small producers to engage in rice cultivation on a massive scale.

Figure 1: Study area ( Bangourain and Koutaba ) in the Noun department
Primary data were collected using a semi-structured questionnaire comprising closed and open-ended questions, from February to May 2020-2021 , as well as field observations. These data were supplemented by direct observation of the author in the field to ensure the relevance and consistency of the information collected.
The unit of analysis consists of rice farmers, whether or not they are members of an agricultural cooperative. Rice farmers in the Bangourain and Koutaba districts of this department formed the sampling frame for this study. Participants were selected using a snowball sampling technique because available lists are often biased and generally include people who do not actually practice rice farming. The sample of 72 rice farmers is divided into two groups: 36 cooperative members and 36 non-members.
Once the data were collected, they were coded, analyzed, entered, grouped, and classified according to the logical order of the study objectives. Data processing was carried out using SPSS ( Statistical Package for Social Sciences) 14 and Excel software. After processing, the data were analyzed and presented quantitatively and qualitatively in the form of tables, graphs, and other necessary figures. The methods used for data analysis include the logistic regression model.
For this type of data, the logit model is appropriate due to: (a) the small sample size used in this study (N=72); (b) the availability of SPSS software, which is well suited for logit but not for probit , which is more easily estimated with STATA software. The logit model is therefore more suitable for analyzing the determinants of rice producers’ membership in a cooperative, due to the limitations of the model (problems of heteroscedasticity and non-distribution of the error, estimation of probabilities outside the interval 0 and 1) ( Jaza , 2015). If we assume that P is the probability of choosing to join a cooperative or not from a vector of independent variables X, the formulation of the model is as follows :
Y= Logit (p) =ln )=α+βX ( 2)
Deriving P from equation (1), we obtain:
P= (3)
P = probability of the occurrence of an event (adhesion or non-adhesion)
X = vector of independent variables that represents the factors influencing the producer’s decision to join or not to join a cooperative
Y = dependent variable which indicates whether producers are members or not members of a cooperative
β = vector of coefficients
α = ordinate at the origin
P/(1-P) is called “ODDS ratio”
Ln [P/(1-P)] is called log ODDS ratio, or ” logit “
Farmer organizations provide various services such as input supply, production financing, credit search, training and marketing (Dugué et al., 2012). Taking into account these services, as well as the producer’s personal characteristics, farm size, land ownership, number of years of experience and production factors, eighteen explanatory variables (X1, X2… X12) likely to influence the producer’s decision to join a cooperative were defined for the logistic regression model used in this study.
By detailing the elements of the vector of independent variables X in a specific way, equations (1) and (2) can be rewritten as follows:
Y= Logit (p) =ln )=α+β 1 X 1 + β 2 X 2 +……+ β 12 X 28
P= (5)
Table 1: Description of the variables in the logistic regression
| Variable type | Mathematical notation | Meaning | Nature | Code used in SPSS | Expected sign |
| Dependent Variable | Y | Membership in a cooperative | Qualitative | 1=Member
0=Non-member |
// |
|
Explanatory Variables |
X 1 | Gender | Qualitative | 1= Male
0= Feminine |
+ |
| X 2 | Age ( years ) | Quantitative | // | + | |
| X 3 | Level education | Qualitative | 1= Primary
2= Secondary 3= Superior 4= No school |
– | |
| X 4 | Area cultivated (ha) | Quantitative | // | – | |
| X 5 | No subsidy | Qualitative | 1=yes; 0=no | + | |
| X 6 | Experience (years) | Quantitative | // | + | |
| X 7 | Yield (t/ha) | Quantitative | // | + | |
| X 8 | Purchase band | Qualitative | 1= yes ; 0=no | + | |
| X 9 | Group sale | Qualitative | 1= yes ; 0=no | + | |
| X 10 | Training | Qualitative | 1= yes ; 0=no | + | |
| X 11 | Property land | Qualitative | 1= owner
0 = tenant |
– | |
| X 12 | Access to popularization | Qualitative | 1= yes ; 0=no | + |
The odds ratio (or ODDS ratio) is used to simplify the interpretation of the results obtained. In this study, it is defined for various independent variables as the quotient between the probability that a producer joins a cooperative and the probability that he does not join. When β is greater than 0, the ODDS ratio is greater than 1, and when it is less than 0, this ratio is less than 1. In this case, the quotient 1/ exp (β), which is the inverse of the ODDS ratio, is calculated to facilitate the interpretation of this coefficient when it is negative ( Jaza , 2015).
Characteristics of the rice farmers surveyed
Table 2: Socioeconomic characteristics of farmers
| Variables | Membership in a cooperative | |||||
| Member | Non-member | Total | ||||
| Gender | Frequency | % | Frequency | % | Frequency | % |
| Female | 6 | 16.7 | 20 | 55.6 | 26 | 36.11 |
| Male | 30 | 83.3 | 16 | 44.4 | 46 | 63.89 |
| Total | 36 | 100 | 36 | 100 | 72 | 100 |
| Age | ||||||
| [15-30[ | 0 | 0 | 6 | 16.7 | 6 | 8.33 |
| [30-45[ | 6 | 16.7 | 12 | 33.3 | 18 | 25 |
| [45-60[ | 16 | 44.4 | 16 | 44.4 | 32 | 44.44 |
| [60-75[ | 13 | 36.1 | 2 | 5.6 | 15 | 20.83 |
| [˃75[ | 1 | 2.8 | 0 | 0 | 1 | 1.39 |
| Total | 36 | 100 | 36 | 100 | 72 | 100 |
| Education level | ||||||
| Primary | 26 | 72.2 | 26 | 72.2 | 52 | 72.22 |
| Secondary | 5 | 13.9 | 6 | 16.7 | 11 | 15.28 |
| Superior | 2 | 5.6 | 0 | 0 | 2 | 2.78 |
| No school | 3 | 8.3 | 4 | 11.1 | 7 | 9.72 |
| Total | 36 | 100 | 36 | 100 | 72 | 100 |
| Marital status | ||||||
| Bachelor | 0 | 0 | 1 | 2.8 | 1 | 1.39 |
| Married | 36 | 100 | 35 | 97.2 | 71 | 98.61 |
| Total | 36 | 100 | 36 | 100 | 72 | 100 |
The table presents the socioeconomic characteristics of the rice farmers surveyed. Among the cooperative members, 83.3% are men and 16.7% are women. However, among non-members, the proportion of women (55.6%) is higher than that of men (44.4%). The low proportion of women heading rice farms can be explained by the arduous nature of this activity and the difficulties they face accessing land. Although men are the majority in rice production, they are supported by women in activities such as plowing, transplanting, and winnowing rice. The religious and cultural norms of the region make agricultural cooperatives, economic and autonomous entities operating through decision-making mechanisms, not very conducive to the development of women.
Regarding age, the [45-60] age group is the most represented among members and non-members of agricultural cooperatives, with a percentage of 44.44%, followed by the [30-45] age group with 25%. Members of rice producers’ cooperatives confirm that young people are not very interested in the idea of a cooperative, as they believe that it does not pay immediately after receiving the product, which makes them less enthusiastic about joining. The lack of interest among young people in agricultural activity in the study area would explain this result. Indeed, young people consider agriculture as an activity intended for the elderly and prefer activities offering daily income such as motorcycle transport ( benskineurs ) and trade, or migrate to urban centers in search of better-paid jobs. However, the high proportion of elderly people in rice cultivation poses the problem of an aging workforce and, consequently, low productivity and agricultural yields in the area.
Education level is a key factor in measuring an individual’s ability to understand and implement extension workers’ recommendations ( Ma’agoum , 2020). A high level of education allows rice farmers to grasp the benefits offered by a cooperative and more effectively adopt the innovations it proposes. According to their membership in a cooperative, the education levels of member rice farmers are distributed as follows: primary (72.2%), secondary (13.9%), higher (5.6%), and no education (8.3%). For non-members, the percentages are respectively: primary (72.2%), secondary (16.7%), higher (0%), and no education (11.1%). These results show that rice farmers with a higher level of education are often members of cooperatives.
Furthermore, the low school enrollment rate of women in the study area could explain their low representation in agricultural cooperatives. Among the 26 women rice farm owners, 76.9% have a primary education, 3% have a secondary education, none have pursued higher education, and 3% have received no education. The majority of rice farmers surveyed are Muslim, with 98.61% Muslim and 1.39% Christian. This result partly explains the low presence of women in agricultural cooperatives, as certain beliefs prohibit women from being in frequent contact with men other than their spouse.
Regarding marital status, marriage has great social value in Cameroon, especially in the west of the country. A rice farmer’s marital status can indicate their level of commitment to their activities, as their efforts are influenced by their social responsibilities. Table 3 shows the distribution of rice farmers according to their marital status and membership in an agricultural cooperative. The results confirm that 100% and 97.2% of cooperative members and non-members are married, respectively.
Experience in rice cultivation
The number of years in rice cultivation is an important factor in determining the rice farmer’s membership in the agricultural cooperative.
Table 4: Distribution of rice farmers according to the number of years of experience
| N | Minimum | Maximum | Average | Standard deviation | |
| Cooperative members | 36 | 2 | 40 | 17.5 | 10.87 |
| Non-members | 36 | 1 | 30 | 10.17 | 7.47 |
| Total | 72 | 1 | 30 | 13.84 | |
| Difference | // | 1 | 10 | 7.33 ***
(Z= -2.76) |
3.4 |
The number in parentheses represents the Z value in the Wilcoxon Man-Whitney test (U-test)
The average years of experience are higher among cooperative members (17.5 years) than among non-members (10.17 years), and this difference is significant at 1% (p-value=0.006<0.01). This observation is explained by the fact that increased experience in rice cultivation is generally accompanied by an increase in cultivated areas and, consequently, an increased need for agricultural inputs. The cooperative then becomes a means for these rice farmers to acquire the necessary inputs at lower costs to ensure their production.
Challenges of rice growers’ membership
Production subsidy
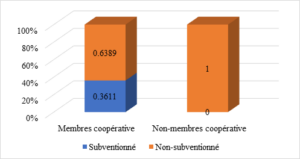
Figure 2: Subsidy for rice-growing activity
As Figure 2 illustrates, only 36.11% of producers who are members of an agricultural cooperative receive subsidies, compared to 0% for non-members. This disparity is explained by the fact that cooperatives provide their members with supervision and regular monitoring of activities by agricultural post heads, as well as through various programs and projects implemented in the region. These initiatives facilitate the identification of problems encountered by producers and the provision of solutions in the form of subsidies.
Group purchase of inputs

Figure 3: Group purchases of inputs by rice farmers
Figure 3 shows that only 38.89% of members of three different cooperatives make group purchases, compared to 61.11% who do not. It is worth noting that cooperative members benefit from credits for the purchase of inputs at favorable rates. However, at the time of group sales, market prices increase, and some members prefer to sell their products to other buyers not recognized by the cooperative to maximize their profits. This situation occurs because prices are not fixed and are almost not controlled by the Cameroonian government. Once the product is sold, these members repay their credits within the cooperative. Furthermore, none of the non-members practice group purchases of inputs (100%), which shows that they do not see any interest in it.
Group sale of rice
Group marketing of products is an initiative of agricultural cooperatives aimed at regulating the market price of rice and increasing the income of local rice farmers. Figure 4 illustrates the proportion of rice farmers participating in group marketing according to their membership in an agricultural cooperative. In Cameroon, a study by Kamdem (2014) on cocoa demonstrated that collective marketing has a statistically significant and positive effect on the net price received by producers.
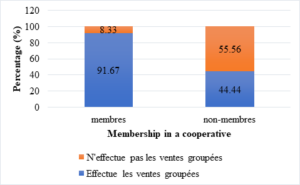
Figure 4: Distribution of group sales by rice growers
Figure 4 shows that 91.67% of cooperative members participate in rice joint sales, while 8.33% do not. In contrast, among non-members, 55.56% do not participate in joint sales, while 44.44% do. The participation of non-members in joint sales in this study is explained by their access to agricultural extension through programs such as ACEFA and the PDRM-II project, which also encourage individual producers while incentivizing them to join producer organizations.
Access to land ownership
Table 5: Distribution of rice farmers according to land ownership
| Variable | Membership in a cooperative | |||||
| Land ownership | Member | Non-member | Total | |||
| Frequency | % | Frequency | % | Frequency | % | |
| Tenant | 1 | 2.8 | 1 | 2.8 | 2 | 2.78 |
| Owner | 35 | 97.2 | 35 | 97.2 | 70 | 97.22 |
| Total | 36 | 100 | 36 | 100 | 72 | 100 |
The Chi-square test to determine the relationship between membership in an agricultural cooperative and a producer’s land ownership (X²=0.00, Sig =1˃0.1 not significant at 10%) indicates that, in the study area, membership in a cooperative does not depend on a rice farmer’s land ownership. In accordance with the results of the Chi-square test, Table 5 shows that, for both members and non-members of agricultural cooperatives, 2.8% of rice farmers are tenants and 97.2% are owners of their rice plots. Land is obtained either by donation from the village chief concerned, by donation from the chairmen of the boards of directors of the cooperatives that have undertaken the development of lowlands for rice cultivation, or by purchase from third parties.
Farm area
Land is the main factor in agricultural production.
Table 6: Distribution of farm area
| N | Minimum | Maximum | Average | Standard deviation | |
| Total area in ha | |||||
| Cooperative members | 36 | 0.03 | 6 | 1,566 | 1,738 |
| Non-members | 36 | 0.05 | 1.5 | 0.464 | 0.361 |
| Total | 72 | 0.03 | 6 | 1,015 | – |
| Difference | 0 | 0.02 | 4.5 | 1,102 ***
(Z= -2.99) |
1,377
|
| Cultivated area in ha | |||||
| Cooperative members | 36 | 0.03 | 5 | 0.592 | 0.838 |
| Non-members | 36 | 0.05 | 1.5 | 0.321 | 0.245 |
| Total | 72 | 0.03 | 5 | 0.456 | |
| Difference | // | 0.02 | 3.5 | 0.271 NS
(Z= -1.795) |
0.593 |
Note: – significant at 1%
-significant at 5%
-NS: not significant
– The number in brackets represents the value of t in the Student ‘s t- test
-The number in parentheses represents the Z value in the Wilcoxon Man-Whitney test (U-test)
The table shows that the average farm area of cooperative members (1.566 ha) is larger than that of non-members (0.464 ha). This difference is significant at 1% (p-value = 0.003 < 0.01). This result can be explained by the fact that cooperative members are constantly exposed to agricultural innovations and benefit from monitoring and support from government programs, which encourages them to increase their cultivated areas to increase their income.
Regarding the areas cultivated, the averages are 0.592 ha for cooperative members and 0.321 ha for non-members, although this difference is not significant (p-value = 0.073 > 0.05). The distribution of distances between places of residence and rice farms is also presented in Table 6. Cooperatives members travel on average 3.19 km to reach their farms, compared to 2.12 km for non-members. This difference is significant at the 5% level (p-value = 0.032 < 0.05).
Yield (t/ha)
Table 7 presents the descriptive statistics, as well as the differences in average yields (t/ha) depending on whether or not the member belongs to an agricultural cooperative.
Table 7: Distribution of rice farmers’ yield (t/ha)
| N | Minimum | Maximum | Average | Standard deviation | |
| Cooperative members | 36 | 0.5 | 10 | 5.46 | 2.55 |
| Non-members | 36 | 1 | 10 | 6.45 | 2.34 |
| Total | 72 | 0.5 | 10 | 5.96 | |
| Difference | // | 0.5 | 0 | 0.99 * [t= -1.7] | 0.21 |
Note: – significant at 10%
The number in brackets represents the value of t in the Student ‘s t- test
Table 7 shows that the average rice yield in the study area is 5.96 t/ha. Cooperatives members achieve an average yield of 5.46 t/ha, while non-members achieve 6.45 t/ha. The difference in the means is 0.99 t/ha, and this value is significant at 10% (p-value = 0.094 < 0.1).
On the ground, there is discouragement among cooperative members who remain inactive while waiting for PDRM-II subsidies (a government project). This contributes to their low returns. Subsidies often arrive late, which demotivates some members, and sometimes unfulfilled promises exacerbate this situation.
Econometric analysis
The binary logistic regression model was used to identify and analyze the factors influencing rice producers’ membership in an agricultural cooperative. This analysis focuses on the influence of each explanatory or independent variable ( Xj ) on the dependent variable (Y).
The previous analysis allowed the selection of 18 explanatory variables for this study, including gender, age, education level, land ownership, number of years of experience in rice cultivation, cultivated area, group purchase of production inputs, group sale of rice, rice yield, access to extension, training and access to production subsidies. The Pearson correlation matrix was used to check the multicollinearity of the explanatory variables, that is, to ensure that there is no linear relationship between them. This test made it possible to eliminate a variable correlated with another, namely the training received on rice cultivation, which is correlated with access to agricultural extension.
The model was validated, as in 91.7% of cases, the dependent variable was correctly predicted. The Omnibus test of the model coefficients yielded a high chi-square (χ² = 75.591 and P-value = 0.000). In addition, all the selected variables, except for the level of education, land acquisition mode and rice yield, exhibited the expected signs. Table 8 presents the results of the logistic regression model obtained from the selected variables.
Table 8: Results of the logistic regression model
| Explanatory variables | B | Sig | Exp (B) | 1/ Exp (B) |
| Gender (0=female, 1=male) | 1,428 | 0.29 | 4,169 | // |
| Age (years) | 0.213 *** | 0.006 | 1,237 | // |
| Education level | 0.161 | 0.867 | 1,175 | // |
| Land ownership (1=owner, 0=rental) | 1,189 | 0.543 | 3,284 | // |
| Professional experience (years) | -0.229 ** | 0.048 | 0.795 | 1,258 |
| Cultivated area (in ha) | -4,475 | 0.212 | 0.011 | 90.9 |
| Group purchase (0=no, 1=yes) | 21,645 | 0.997 | 2.5*10 9 | // |
| Group sale (0=no, 1=yes) | 4,685 *** | 0.010 | 108,297 | // |
| Rice yield (tons/ha) | -0.617 | 0.249 | 0.539 | 1,855 |
| Access to popularization (0=no, 1=yes) | 3,083 * | 0.085 | 21,828 | // |
| Production subsidy (0=no, 1=yes) | 20,709 | 0.72 | 77,816 | // |
| Constant | -7,846 | 0.112 | 0.00 | // |
| Number of observations N=72, -2Log likelihood ratio= 24.223 a Nagelkerke R 2 = 0.867, percentage correct prediction = 94.4%, Omnibus test of the model coefficients χ²=73.56
***significant at 1%, **significant at 5%, *significant at 10% |
Arguments in the literature regarding the factors influencing producers’ membership in agricultural cooperatives are divergent. By comparing our logistic regression results (Table 8) with recent studies addressing similar issues in Cameroon or Africa, several factors were identified.
For the age of rice farmers, this variable has a positive and significant coefficient at 1%, indicating that older rice producers are more likely to join an agricultural cooperative. This is confirmed in Table 8 where the ODDS ratio is 1.237 (greater than 1). Thus, with each additional year, the probability of joining a cooperative increases by 1.237 units. These results are consistent with those of Yoli (2020) and Bernard et al. (2008), who showed that an increase in the producer’s age increases the probability of belonging to a cooperative by 0.04% in western Côte d’Ivoire. According to these authors, young people do not like the idea of a cooperative because it does not pay directly after receiving the product.
On the other hand, Karli et al. (2006), in their study on the factors affecting farmers’ decision to join an agricultural cooperative in Turkey, concludes that the probability of joining decreases with increasing producer age. This difference is explained by the specific context of Noun County, where society is undermined by juvenile delinquency, rural exodus, cybercrime and illegal social practices, justifying the disinterest of young people in agriculture.
For group selling, this variable has a positive and significant coefficient at 1%. This indicates that rice farmers who participate in group rice sales are more likely to join an agricultural cooperative. This is confirmed in Table 8 with an ODDS ratio of 108.297 (greater than 1). Thus, rice farmers who carry out group sales have a probability 108.297 times higher of joining a cooperative than those who do not. On the other hand, this variable was not significant in Madjeu ‘s (2016) study on maize production in Mbouda . This difference can be explained by the fact that rice is often marketed in the form of paddy due to the lack of processing plants, pushing producers to seek partnerships to sell their products more easily. Group selling, being a common activity of agricultural cooperatives, encourages producers to join it, because it helps regulate price fluctuations in the locality.
Access to extension, with a positive and significant coefficient at 10%, also influences rice farmers’ membership in an agricultural cooperative. This is confirmed in Table 8 with an ODDS ratio of 21.828 (greater than 1). Rice farmers in contact with extension agents have a 21.828 times higher probability of joining an agricultural cooperative. This result is consistent with that of Madjeu (2016), who shows that the probability of joining a producer organization (PO) for maize producers in contact with an agricultural advisor in Mbouda is 5.96 times higher than for those who are not. Producers who interact with agricultural extension agents are better informed and aware of the benefits of a producer organization, such as access to information, training, and technical innovations (Dugué et al., 2012). Thus, membership in a cooperative would allow producers to constitute a real force for addressing their priorities and needs to public authorities.
Although the coefficient of the gender variable is not significant, it has a positive influence on producers’ membership in a cooperative, such that men are 4.169 times more likely to join an agricultural cooperative than women. This result contradicts that obtained by Madjeu (2016), who concluded that gender does not influence the decision of maize producers in the Bamboutos to join a PO. This difference can be explained by the arduousness of rice cultivation compared to that of maize, which translates in the field into a high involvement of men (63.89%) compared to women in this crop.
Similarly, although the coefficient of the education level variable is not significant, this variable positively influences cooperative membership. This is confirmed in Table 8 where the ODDS ratio is 1.175 (greater than 1). Thus, the most educated rice farmers have a 1.175 times higher probability of joining an agricultural cooperative. This result is consistent with those of several authors who have studied producers’ membership in agricultural cooperatives in Turkey and Côte d’Ivoire. These studies (Karli et al., 2006; Yoli, 2020) conclude that the level of education significantly and positively influences the probability of joining an agricultural cooperative. According to these authors, producers with high levels of education communicate more easily with members, have high social capital, and share and use innovations better. This is verified in the field, where 5.6% of cooperative members have higher education compared to 0% of non-members.
Similarly, although the coefficient of the land ownership variable is not significant, this variable positively influences cooperative membership. This is confirmed in Table 8 where the ODDS ratio is 3.284 (greater than 1). Thus, rice farmers who own their plot have a probability 3.284 times higher of joining an agricultural cooperative. This result corroborates that of Madjeu (2016), according to which maize producers who own their land have a probability 4.869 times higher of joining a producer organization (PO) compared to tenants in the district of Mbouda .
Furthermore, although the coefficient of the group purchasing of inputs variable is not significant, it positively influences cooperative membership. Producers who purchase agricultural inputs together have a 2.5×10⁹ times higher probability of joining an agricultural cooperative. This result is supported by Yoli (2020) in his work on assessing the impact of agricultural cooperatives in the Sidama region (Ethiopia) on livelihoods. His results indicate that cooperatives improve the living standards of farmers using their services by ensuring a reduction in production input costs. Thus, rice farmers who purchase together are more likely to join the cooperative to benefit from these advantages.
Furthermore, although the production subsidy variable is not significant, it positively influences cooperative membership. Producers who received production subsidies have a 77.816 times higher probability of joining an agricultural cooperative. This result contradicts that of Yoli (2020), which shows that access to the subsidy negatively influences cocoa producers’ membership in an agricultural cooperative. This contradiction is explained in the context of this study by the fact that public development programs such as PDRM-II generally work with producers structured in agricultural cooperatives, which may encourage rice farmers who have already received subsidies to join them to benefit more.
Unlike the previously mentioned variables, the number of years of experience has a negative coefficient and is significant at the 5% level. This means that rice farmers with more years of experience are less likely to join an agricultural cooperative. Furthermore, as shown in Table 8, since B is negative, the inverse of the odds ratio (1/ Exp (B)) is used to interpret this variable. Thus, an increase of one year of experience decreases the probability of joining the cooperative by 1.258 units. This result is consistent with that of Bernard et al. (2008), who found that experience is not a determining factor for joining a cooperative. The most experienced rice farmers tend to minimize the importance of cooperatives, believing that they have nothing more to learn from them. However, Yoli (2020) found that the more experienced a cocoa farmer is, the more likely they are to belong to a cooperative, making experience an important factor for membership in their study. This contradiction can be explained by the fact that cooperatives are just as beneficial for less experienced farmers as for more experienced ones, especially with changes in agricultural practices and new innovations.
Cultivated area has a negative and insignificant coefficient (Table 8). Thus, an increase in cultivated area of 1 ha reduces the probability of joining an agricultural cooperative by 90.9 units.
Similarly, rice yield has a negative and insignificant coefficient, contrary to what was expected (Table 8). Since B is negative, the inverse of the odds ratio (1/ Exp (B)) is used for this variable. Thus, rice farmers with high yields are 1.855 times more likely to not join the cooperative than those with low yields. Like experienced producers, rice farmers with high yields believe that the cooperative has nothing more to offer them.
Agricultural cooperatives are perceived as solutions to rice production problems in Cameroon. This study aims to analyze the determinants influencing rice farmers’ membership in agricultural cooperatives in the Noun department. The socioeconomic characteristics of rice farmers in the study area show that rice farming is primarily practiced by men, the majority of whom are members of cooperatives. Factors influencing rice farmers’ membership in agricultural cooperatives in the Noun department include: rice farmer’s age, group selling, access to extension services, gender, education level, land ownership, group purchasing of inputs, yield, and years of experience.