Dynamic Model Development And Automotive Dynamics Simulation Utilizing Matlab/Simulink
Huynh Thanh Banh, Thach Ngoc Phuc
Huynh Thanh Banh: School of Engineering and Technology, Tra Vinh University
Thach Ngoc Phuc: School of Engineering and Technology, Tra Vinh University
This study focuses on the modeling and simulation of an electric vehicle (EV) using MATLAB/Simulink. The research aims to develop an accurate simulation model to analyze the vehicle’s dynamics, powertrain performance, and energy consumption under various driving conditions. The model integrates several subsystems, including the BLDC motor, battery, and energy management system, to replicate real-world driving scenarios. Simulation results show how road surface conditions, driving cycles, and regenerative braking influence the performance of the VinFast VF7, including acceleration, top speed, and battery state-of-charge (SOC). The study indicates that the VinFast VF7 is capable of completing a round trip from Tra Vinh to Ho Chi Minh City (286.2 km) with 78% of battery consumption, ensuring sufficient range for the journey. With this model, we can evaluate the vehicle’s performance under different desired driving cycles for the VinFast VF7 or other electric vehicles on the market. Based on this, appropriate recommendations can be made for vehicle operation and the placement of charging stations.
Keywords: EV dynamics, MATLAB/Simulink for EVs, Vinfast VF7, electrical vehicle simulation.
The automotive industry is undergoing a significant transformation, with a clear shift toward electric vehicles (EVs). This transition is primarily driven by increasing concerns about environmental sustainability, the enforcement of stringent emissions regulations, and continuous advancements in battery technology. In response, governments worldwide have implemented various policies to accelerate EV adoption, positioning it as a key strategy for reducing greenhouse gas emissions and decreasing reliance on fossil fuels. According to the International Energy Agency (IEA), the total number of EVs on the road exceeded 26 million in 2023, marking a substantial increase from just 10 million in 2020. Moreover, the EV market is expanding at an unprecedented rate, with China, Europe, and the United States leading this transition. In particular, China accounted for over 60% of global EV sales in 2023, largely due to strong government incentives and remarkable progress in domestic EV manufacturing.
As battery technology and charging infrastructure continue to advance, consumer acceptance of electric mobility is also increasing significantly. In response, major automotive manufacturers have expanded their production of electric vehicle (EV) models to meet the growing market demand. Among the most notable EVs, Tesla Model 3/Y/S/X stands out for its long-range battery technology, advanced autonomous driving capabilities, and high-performance electric drivetrains. Similarly, the Volkswagen ID.4, a widely adopted electric SUV, features an efficient battery system and scalable MEB platform. In the Chinese market, BYD Atto 3 and Han EV lead with Blade Battery technology, offering enhanced safety and longevity. Meanwhile, Hyundai Ioniq 5 and Kia EV6 integrate an 800V fast-charging architecture, enabling ultra-fast charging capabilities. Ford Mustang Mach-E and F-150 Lightning showcase Ford’s commitment to electric mobility, delivering high-performance SUVs and pickup trucks with a balance of power and efficiency. Additionally, the Porsche Taycan, a high-performance electric sports car, is equipped with advanced thermal management and energy recovery systems for superior driving dynamics. Each of these EV models incorporates state-of-the-art battery management systems (BMS), regenerative braking, and intelligent energy distribution mechanisms, ensuring optimal performance, improved efficiency, and extended driving range. These innovations collectively enhance the viability of EVs for mainstream consumers, driving further adoption and development in the industry.
Electric vehicle (EV) modeling and simulation using MATLAB/Simulink have become essential tools in vehicle development, enabling researchers to analyze powertrain performance, energy consumption, and dynamic behavior under different driving conditions. This approach allows for rapid prototyping, validation of control algorithms, and optimization of EV components before physical implementation. Globally, significant research efforts have been dedicated to refining EV simulation models, addressing various aspects such as battery management, regenerative braking, and power distribution strategies. In Vietnam, research on EV simulation using MATLAB/Simulink has gained traction in recent years. Huynh et al. [1] developed a model for an extended-range electric vehicle (E-REV), integrating an internal combustion engine (ICE) as a range extender and using MATLAB/Simulink to analyze battery state-of-charge (SOC) control strategies. Similarly, Giang and Mien [2] focused on hybrid vehicle control, demonstrating the effectiveness of MATLAB/Simulink in optimizing energy flow and minimizing fuel consumption. Meanwhile, Bao et al. [3] applied Simscape in MATLAB/Simulink to simulate battery management systems for EVs, ensuring safe and efficient battery operation. Internationally, various studies have demonstrated the effectiveness of MATLAB/Simulink in EV modeling. Yang [4] presented a comprehensive framework for pure EV simulation, integrating key subsystems including motor dynamics, battery characteristics, and control algorithms. Similarly, Kumar et al. [5] developed a simulation model for an EV with a permanent magnet synchronous motor (PMSM), focusing on energy efficiency and performance under different drive cycles. Additionally, Kiyakli and Solmaz [6] focused on developing an electric vehicle model using MATLAB/Simulink to analyze energy consumption and vehicle performance. The model simulates dynamic systems, regenerative braking, and powertrain efficiency, evaluating performance under different driving cycles like NEDC and WLTP.
These studies collectively highlight the versatility of MATLAB/Simulink in capturing the complex interactions within EV systems.
These studies reflect a growing interest in MATLAB/Simulink-based EV modeling in Vietnam, with research efforts aligning with international trends. However, challenges remain in fully integrating real-world driving conditions, optimizing energy management strategies, and developing more comprehensive vehicle control algorithms. As EV adoption increases in Vietnam, further advancements in MATLAB/Simulink-based simulation will be crucial for supporting the design and development of efficient and reliable EVs. This study aims to build upon existing research by developing a robust and adaptable MATLAB/Simulink model for EV dynamics simulation. By incorporating real-world driving scenarios and advanced energy optimization techniques, the research will contribute to improving EV performance and expanding simulation capabilities in Vietnam’s growing automotive industry.
Modeling Electrical Vehicle Dynamic System In Matlab/Simulink
The Simulink model of the VinFast VF7 is designed to accurately represent the vehicle’s dynamics and powertrain system, enabling precise analysis and control of its motion under various driving conditions. The model is structured into several key blocks, each simulating a critical subsystem of the vehicle. At the core of the model, the Vehicle Body block serves as the central element that integrates various components, ensuring accurate interaction between the powertrain, wheels, and external driving conditions. The powertrain system consists of the Brushless DC (BLDC) motor, transmission, differential, and tire model, which work together to generate the required propulsion force. The Input and Output blocks define essential driving conditions, where the Input block regulates key parameters such as the driving cycle, wind speed, and road inclination angle, providing a realistic representation of the vehicle’s operating environment. The driving cycle signal plays a crucial role in vehicle control, as it is fed into the Driver block, where acceleration and deceleration commands are processed. These commands are then transmitted to the central control unit, which determines the required current supply to the BLDC motor. By precisely controlling the motor torque output, the system ensures that the driven wheels generate the necessary traction force, allowing the vehicle to follow the desired speed profile as defined by the driving cycle. A feedback loop is implemented to enhance control accuracy, where the actual vehicle speed is continuously monitored and sent back to the central control unit. This closed-loop control mechanism enables real-time adjustments, ensuring that the torque demand from the motor aligns with the vehicle’s dynamic requirements. The BLDC motor draws electrical energy from the Lithium-Ion battery pack, which serves as the primary power source for propulsion. The Scope block generates graphical simulation output, while the To Workspace block exports simulation data. The MATLAB/Simulink model of Vinfast VF7 is presented in Fig. 1 The manufacturer-specified technical parameters are integrated into the model’s blocks to execute the simulation, as shown in Table 1. The Magic Formula coefficients and rolling resistance for a dry asphalt road are Table 2 [7, 8].
Table 1: Specifications of Vinfast VF7
| Parameters | Value |
| Overall dimension (length × width × height) (mm) | 4545×1890×1636 |
| Wheelbase (mm) | 2840 |
| Distance between the center of the front and rear wheel (mm) | 1530/1540 |
| Minimum Ground Clearance (mm) | 190 |
| Gross weight (kg) | 2085 |
| Maximum power kW | 130 kW |
| Power train | FWD |
| Battery capacity | 60 kW (167 Ah) |
Table 2: The coefficient matrix and rolling resistance of different road types
| Type of road | Coefficient matrix | Rolling resistance | |||
| B | C | D | E | ||
| Dry asphalt road | 19.25 | 1.65 | 0.92 | 0.6 | 0.011 |
| Wet asphalt road | 15.8 | 1.6 | 0.62 | 0.6 | 0.013 |
| Concrete | 17.11 | 1.67 | 0.82 | 0.6 | 0.016 |
| Sand | 5.56 | 1.515 | 0.11 | 0.6 | 0.07 |
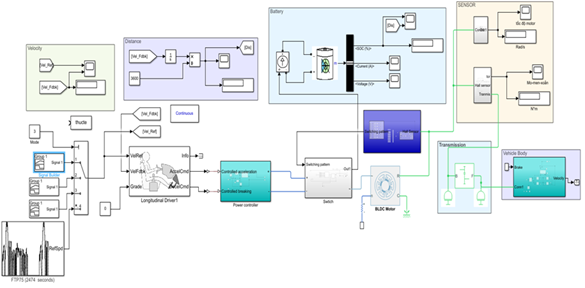
Figure 1: The electric car model in MATLAB/Simulink
The first investigation focused on evaluating the vehicle’s speed performance across different road surfaces, including dry asphalt, concrete, wet asphalt, and sand roads, as shown in Fig. 2. The results indicated that road surface conditions significantly influence the vehicle’s acceleration and maximum speed. On dry asphalt, the vehicle reached 150 km/h within approximately 27s, benefiting from high traction and minimal wheel slip. Similarly, on concrete, acceleration was slightly lower but remains efficient, with the vehicle reaching 150 km/h shortly after 28 s due to moderate friction characteristics. However, on wet asphalt, the vehicle took around 30 s to reach its maximum speed, as reduced friction results in higher wheel slip and lower acceleration efficiency. The most significant performance drop occurs on sand roads, where the vehicle struggles to exceed 30 km/h by the end of the simulation, primarily due to severe traction loss and inefficient power transfer. These findings emphasize the critical role of road friction coefficients in electric vehicle dynamics. On high-friction surfaces such as dry asphalt and concrete, the BLDC motor efficiently transfers power to the wheels, ensuring rapid acceleration and optimal performance. Conversely, on low-friction surfaces like wet asphalt and sand, wheel slip increases, leading to reduced acceleration and a longer time to reach target speeds. This suggests that implementing adaptive traction control and torque management algorithms is crucial for enhancing drivability and energy efficiency under varying road conditions.
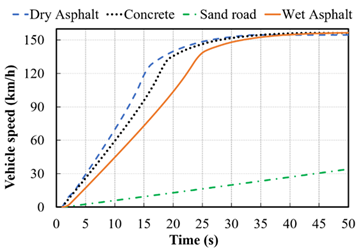
Figure 2: The acceleration capability of the vehicle on different types of road
Figure 3 shows the FTP-75 cycle test and simulated vehicle speed, with the black line representing the desired speed and the red dashed line indicating the simulated vehicle speed. Overall, the simulation closely follows the target speed, demonstrating the system’s ability to replicate standard driving conditions accurately, ensuring reliable fuel consumption and emission assessments. The relationship between travelled distance and the State of Charge (SOC) of the battery during the FTP-75 cycle test is shown in Figure 4. Initially, the SOC exhibits a gradual decline, reflecting moderate energy consumption at lower speeds. As the cycle progresses, the SOC decreases at a nearly linear rate, suggesting that energy consumption remains relatively stable under urban driving conditions. However, a notable trend emerges during deceleration phases, where a slight increase or a slower decline in SOC can be observed. This indicates that regenerative braking is actively recovering energy and partially recharging the battery, thereby improving overall energy efficiency. Moreover, in the middle section of the cycle (from 1356s to 1994s), the SOC remains nearly constant, which corresponds to vehicle stops, during which no energy is consumed for propulsion. This behavior underscores the effectiveness of the energy management system in conserving battery charge when the vehicle is stationary. By the end of the test cycle, the total travelled distance reaches approximately 17.9 km, while the remaining battery SOC is around 94%. This finding suggests that the vehicle has consumed only a small fraction of its battery capacity, thereby demonstrating efficient energy utilization.
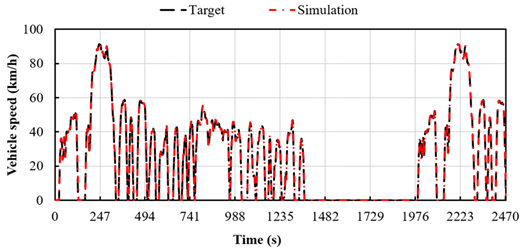
Figure 3: FTP-75 cycle test and simulated vehicle speed
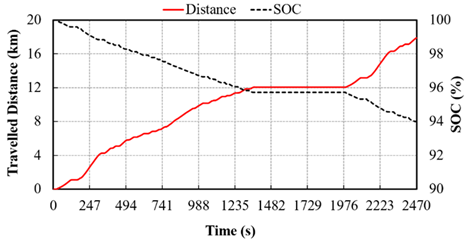
Figure 4: Travelled distance and SOC during FTP-75 cycle test
In addition, Figure 5 depicts the variation of current and torque during the FTP-75 cycle test, where both parameters fluctuate in response to acceleration and deceleration. During acceleration, current and torque increase significantly, with peak values reaching 120A and 2244 Nm, respectively, reflecting high power demand. Conversely, during deceleration, both values drop sharply, indicating energy recovery through regenerative braking. The frequent spikes highlight the stop-and-go nature of urban driving, requiring efficient motor control to ensure smooth operation.
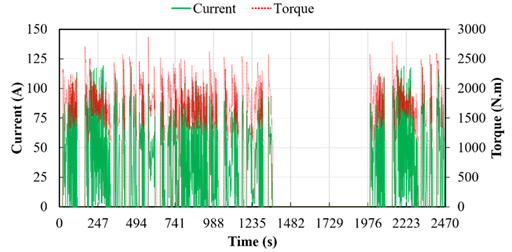
Figure 5: Motor current and wheel torque during FTP-75 cycle test
The test cycle as presented in Figure 6 was designed based on actual traffic conditions between Tra Vinh City and Ho Chi Minh City, aiming to evaluate the vehicle’s performance under realistic driving scenarios. The driving profile incorporates varying speeds, accelerations, and decelerations to simulate real-world urban and highway conditions. The simulation results indicate that the simulated speed closely overlaps with the target speed throughout the test cycle. This confirms that the control system is effectively designed to handle real driving conditions, ensuring accurate vehicle performance replication. The results validate the model’s reliability, demonstrating that the vehicle operates as intended under the defined traffic conditions, making it suitable for further performance and efficiency assessments. Based on the simulation results as plotted in Figure 7, the distance from Tra Vinh to the Mien Tay bus station in Ho Chi Minh City is 143.1 km, and the travel time is approximately 210 minutes. During this trip, the vehicle consumes around 39% of the battery’s energy. Therefore, the total round-trip distance is approximately 286.2 km, and the total battery consumption is about 78%. Given the battery capacity of the VinFast VF7, this is sufficient for the vehicle to complete the entire round trip without running out of charge. However, to ensure greater reliability and avoid potential energy shortfalls, it would be prudent to install an additional charging station at the rest stop. This would provide an opportunity for the vehicle to recharge, especially if there are unforeseen delays or if the energy consumption is higher than expected in real-world conditions. This strategy would enhance the vehicle’s range flexibility and ensure a smoother journey, providing additional peace of mind for long-distance trips.
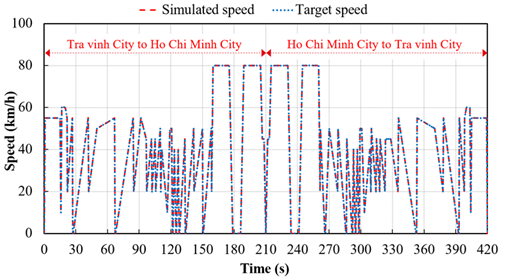
Figure 6: Tra Vinh to Ho Chi Minh city and vice versus cycle test speed
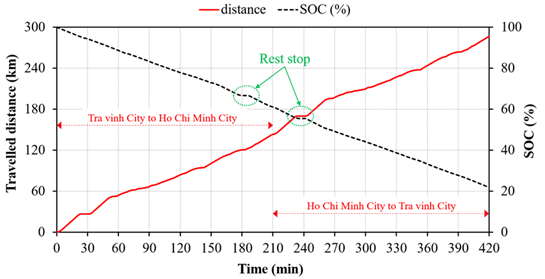
Figure 7: Travelled distance and SOC during the cycle test from Tra Vinh to Ho Chi Minh City and vice versa
The MATLAB/Simulink-based model developed for the VinFast VF7 effectively simulates the vehicle’s performance, energy consumption, and driving dynamics under diverse conditions. Simulation results highlight the significant influence of road surface friction on acceleration and overall vehicle performance, emphasizing the need for adaptive traction control. The model also demonstrates the efficiency of the energy management system, with the vehicle successfully completing a round trip of 286.2 km, consuming only 78% of the battery capacity. Despite this, the study recommends adding charging stations at rest stops for added reliability, ensuring the vehicle’s suitability for long-distance travel. This work contributes to the growing body of research on EV simulations, providing valuable insights for future EV development and energy optimization.