Geophysical Resistivity Analysis of the Tiruvanmiyur Region, Chennai Using Magneto telluric (MT) Surveys
1Mohamed Afzal. J
1Department of Geology, University of Madras, Guindy Campus,
Chennai, India 600025
This study offers a geophysical resistivity investigation of the Tiruvanmiyur region to look into structural features, groundwater potential, and subsurface lithology. Analysis of three MT profiles showed notable differences in resistivity values, which ranged from 17 Ωm to 122 Ωm and were suggestive of various geological formations. Moderate resistivity (22–53 Ωm) was found in Profile 1, indicating a shallow aquifer above a basement rock. The resistivity range (17–104 Ωm) was wider in Profile 2, suggesting a fragmented zone with possible groundwater movement that may have been impacted by faulting. A compact crystalline basement with low groundwater saturation was suggested by the mostly high resistivity (36–122 Ωm) seen in Profile 3. Due of Profile 2’s closeness to the coast, comparative investigation revealed a possible saline intrusion. The study emphasizes how groundwater distribution is impacted by structural discontinuities and lithological variations. The results offer vital information for structural geology, mineral exploration, and groundwater management in the coastal region of Tiruvanmiyur.
Keywords :- Magneto telluric (MT), resistivity, groundwater, crystalline basement, fault zones, saline intrusion, geophysics, Tiruvanmiyur.
Understanding subsurface geological structures is crucial for groundwater management, mineral exploration, and assessing geological hazards. Magnetotelluric (MT) surveys, a passive geophysical method, have been widely used for deep resistivity imaging of the Earth’s crust and lithosphere. The method is based on measuring natural variations in electromagnetic fields to determine subsurface resistivity distributions (Simpson & Bahr, 2021). In coastal regions like Tiruvanmiyur, Chennai, the application of MT surveys is particularly significant due to the potential influence of seawater intrusion, fault-controlled groundwater flow, and sedimentary basin variations (Kumar et al., 2018). The Tiruvanmiyur region is geologically characterized by a mix of sedimentary and crystalline basement formations, influenced by tectonic activity and coastal hydrogeology (Sundararajan et al., 2020). The presence of low-resistivity zones in such regions often correlates with water-saturated formations, weathered rock layers, or fault-controlled aquifers (Patro et al., 2015). Conversely, high-resistivity zones indicate compact, less permeable crystalline rocks such as granite, gneiss, or charnockite (Rao & Moorkerjee, 2016). Several studies have emphasized the importance of MT surveys for groundwater assessment and mineral exploration in India’s coastal and inland regions (Reddy et al., 2019). However, limited research has been conducted in the Chennai coastal belt, particularly in Tiruvanmiyur, where urbanization and groundwater extraction have significantly altered the subsurface hydrogeological conditions. Given this backdrop, this study aims to analyze three MT profiles in Tiruvanmiyur to characterize subsurface resistivity variations, identify potential aquifers, and evaluate the influence of structural discontinuities on groundwater movement.
Study Area
The study was conducted in the Tiruvanmiyur region, a coastal locality in Chennai, Tamil Nadu, India (Figure 1). Tiruvanmiyur lies along the eastern coast of India, bordering the Bay of Bengal, and is part of the Coromandel Coast. The region is characterized by quaternary sediments, weathered crystalline basement rocks, and potential fault-controlled aquifers. The hydrogeology of the area is influenced by monsoonal rainfall, urban groundwater extraction, and possible seawater intrusion. Geologically, Tiruvanmiyur comprises sedimentary sequences of the Cuddalore Formation, overlain by more recent alluvial and coastal deposits. The presence of crystalline basement rocks, including granite, gneiss, and Charnockite, at varying depths indicates a complex subsurface structure, which makes electromagnetic geophysical methods such as magneto telluric (MT) surveys suitable for subsurface investigation
The study utilized the ADMT-300S low-frequency magnetotelluric (MT) equipment to investigate subsurface geological formations, including quartzite, gneisses, shale, and granite. The instrument measures variations in the Earth’s natural electromagnetic field to map resistivity changes, aiding in the identification of deep structural formations (Ravindran et al., 2020). Two copper electrodes (M, N) were employed for transmitting diversity, enhancing depth penetration up to 300 meters (Jeyapaul et al., 2020). The Audio Magnetotelluric (AMT) method, a passive geophysical technique, was used to measure natural electromagnetic field variations, making it effective for analyzing complex geological settings with both vertical and horizontal resistivity changes (Bernard et al., 1990). The ADMT-300S proved highly effective for groundwater exploration and subsurface imaging. Its non-intrusive and cost-effective nature makes it suitable for identifying deep groundwater reservoirs and geological structures at depths from tens to hundreds of meters. The method was applied in the Alangulam region, supporting sustainable water resource management. In the field, MN electrodes were positioned at 10m or 20m intervals along data collection lines. Measurements were taken at 5m depth intervals, covering five profile lines of varying lengths. Data were processed using AIDU 2.3.6 mobile software, which generated 2D resistivity profile maps. The built-in computing functions of the ADMT-300S enabled real-time visualization of geological structures, facilitating the identification of ore bodies, aquifers, and other subsurface features.
Geological Interpretation of Magnetotelluric (MT) Profiles
The Magnetotelluric (MT) resistivity profiles provide a comprehensive understanding of the subsurface geological formations in the Tiruvanmiyur region. The resistivity variations across different depth ranges highlight the presence of distinct lithological units, groundwater zones, and structural features such as faults and fractures. Each profile exhibits unique characteristics that help delineate the hydrogeological potential and geological complexity of the area.
Profile 1: Moderate Groundwater Potential with a Shallow Basement
Profile 1 has a resistivity range of 22–53 Ωm, with low-resistivity zones (22–37 Ωm) dominating the upper sections. (Figure 2) These low-resistivity regions, represented in blue, indicate the presence of conductive materials such as clay-rich formations, weathered basement rocks, and water-saturated sediments. The moderate resistivity values (37–50 Ωm) observed in the middle and deeper sections correspond to semi-consolidated formations such as weathered granite or fractured basement rocks. The high resistivity zones (50–53 Ωm) appearing at greater depths suggest the transition to a dry, compact basement rock, possibly crystalline in nature. (Figure 2) (Table 1) This profile suggests the presence of a shallow aquifer system within the weathered formations, making it a viable target for groundwater exploration. However, the resistivity values indicate a limited depth extent, meaning the aquifer may not have significant storage capacity for long-term extraction.
Profile 2: Complex Subsurface with Fault-Controlled Groundwater System
Profile 2 exhibits a wider resistivity variation, ranging from 17–104 Ωm, indicating a more heterogeneous subsurface. The very low resistivity zones (17–44 Ωm), appearing at mid-depths, suggest significant water saturation, possibly due to fault-controlled groundwater movement or saline water intrusion. Given the coastal proximity of the study area, the presence of deep conductive zones may indicate seawater infiltration, which could pose challenges for freshwater extraction. The moderate resistivity regions (45–80 Ωm) suggest partially weathered formations, such as fractured granite or schist, which could act as secondary aquifers. The high resistivity zones (80–104 Ωm) correspond to compact crystalline basement rocks, likely granite or gneiss, which limit groundwater movement (Figure 3) (Table 1) The rapid resistivity changes observed in this profile suggest possible faulting, which may serve as a conduit for deeper groundwater recharge or mineralization processes.
Profile 3: Dominantly Hard Rock Terrain with Limited Groundwater Potential
Profile 3 has the highest resistivity range among the three profiles, varying from 36–122 Ωm. The low-resistivity zones (36–54 Ωm) are limited and localized, suggesting minor water-bearing formations or clay-filled fractures. The moderate resistivity regions (55–90 Ωm) indicate the presence of transitional rock types, such as weathered basement rocks, but these are less extensive compared to Profiles 1 and 2. The dominant high-resistivity zones (90–122 Ωm) suggest a well-consolidated, dry crystalline basement composed of granite, charnockite, or gneiss. (Figure 4) (Table 1) The lack of significant low-resistivity zones implies minimal groundwater storage potential, making this profile less favorable for water extraction. However, the presence of high-resistivity formations suggests the possibility of hard rock-hosted mineral deposits, making this an area of interest for mineral exploration.
Comparative Analysis of the Three MT Profiles
A comparative evaluation of the three MT profiles provides insights into the subsurface geological variations and their implications for groundwater potential and structural geology.
Profile 2 shows the highest groundwater potential due to its extensive conductive zones, which may indicate deeper water-bearing formations. Profile 1 has moderate groundwater potential, while Profile 3 has limited groundwater storage due to its dominantly high resistivity values. The low-resistivity zones in Profile 2 raise concerns about potential seawater intrusion, which is a common challenge in coastal aquifers. If confirmed, this could limit the availability of potable groundwater and necessitate careful groundwater management strategies. Profile 2 exhibits the most pronounced resistivity variations, suggesting the presence of faulted or fractured zones. This could enhance groundwater movement and also serve as pathways for mineralization. The increasing resistivity values from Profile 1 to Profile 3 indicate a transition from more conductive, weathered formations to hard crystalline basement rocks. Profile 3 is the most compact, suggesting a dry, resistant subsurface (Figure 5) (Table2).
Hydrogeological and Structural Implications
The variations in resistivity across the three profiles have significant implications for groundwater availability, structural geology, and mineral exploration. Profile 1 and Profile 2 indicate potential groundwater storage, with Profile 2 showing deeper water-bearing zones likely influenced by faulting. Profile 3 has limited groundwater potential due to its predominantly resistive basement rock. Profile 2 suggests the possibility of saline water infiltration due to its deep low-resistivity zones. This could be a result of coastal groundwater dynamics, were excessive pumping of freshwater leads to saltwater intrusion. Monitoring groundwater salinity levels in this region is necessary to assess the extent of seawater influence. Profile 2 shows evidence of possible faulting, which could enhance groundwater recharge in deeper sections. Faults often act as conduits for groundwater flow and can also be associated with mineralized zones. Further investigations, such as borehole logging and structural mapping, are recommended to confirm the presence of faults. The high-resistivity zones in Profile 3 suggest the presence of massive crystalline formations, which may host hard rock mineral deposits such as pegmatites or granite-related minerals. (Figure 2,3,4,6)
Final Interpretation
Profiles 1 and 2 show moderate to high groundwater potential and should be considered for sustainable groundwater extraction. Profile 2, however, requires further hydrogeochemical analysis to determine whether seawater intrusion is affecting the groundwater quality. Profile 3 has limited groundwater potential and is not ideal for extensive water extraction. If saline intrusion is confirmed in Profile 2, controlled groundwater extraction and artificial recharge methods (e.g., managed aquifer recharge) should be implemented to prevent further seawater encroachment. The resistivity variations in Profile 2 suggest possible faulting, which warrants further investigation through seismic surveys or borehole drilling. The high-resistivity zones in Profile 3 indicate potential for hard rock mineralization, making it a suitable target for mineral exploration.
The Magnetotelluric (MT) survey in the Tiruvanmiyur region has provided valuable insights into the subsurface geology, groundwater distribution, and structural characteristics. The resistivity variations across the three profiles indicate distinct lithological formations, potential fault-controlled groundwater flow, and possible mineralized zones. Profile 1 suggests a shallow aquifer system within weathered formations, making it a moderate groundwater source. Profile 2 exhibits complex subsurface conditions, likely influenced by faulting, with deeper water-bearing zones and a potential risk of seawater intrusion. In contrast, Profile 3 is dominated by high-resistivity basement rocks, indicating limited groundwater potential but suggesting the presence of hard rock formations that could host mineral resources. These findings underscore the importance of responsible groundwater management, particularly in Profile 2, where saline water intrusion could impact freshwater availability. Further geophysical and hydrogeochemical studies are recommended to confirm the presence of fault zones, evaluate groundwater quality, and explore mineralization potential. Overall, this study highlights the effectiveness of MT resistivity surveys in characterizing subsurface features, supporting groundwater resource assessment, and guiding future geological exploration in coastal environments.
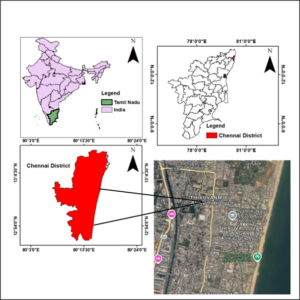
Figure: 1 Study area map
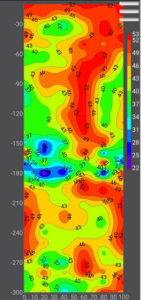
Figure:2 Magneto telluric profile 1
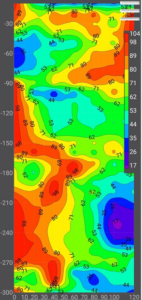
Figure:3 Magneto telluric profile 2
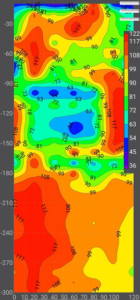
Figure:4 Magneto telluric profile 3
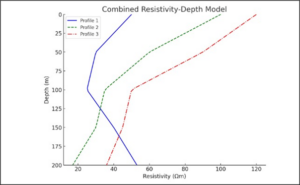
Figure:5 Graphical representation of combined Resistivity Depth
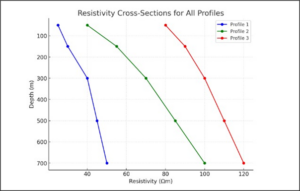
Figure:6 Graphical Representation of Resistivity cross section
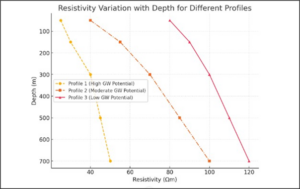
Figure:7 Graphical Representation of Resistivity variation with Depth for Different profiles
Table : 1 Represent the Geological Indication for the three MT profiles
| Profile | Key Features | Geological Indication |
| Profile 1 | Moderate resistivity, some water saturation | Shallow aquifer over a basement |
| Profile 2 | High resistivity variations, deep conductive zones | Fractured rock with potential fault-related groundwater movement |
| Profile 3 | Predominantly high resistivity | Dry, crystalline basement with minimal groundwater |
Table: 2 Represent the comparitive analysis of the MT profiles 1,2 and 3
| Feature | Profile 1 | Profile 2 | Profile 3 |
| Max Resistivity (Ωm) | 53 | 104 | 122 |
| Min Resistivity (Ωm) | 22 | 17 | 36 |
| Depth of Low Resistivity | ~150-180m | ~120-180m | ~90-150m |
| Groundwater Potential | Moderate | Strong | Low |
| Rock Compactness | Medium | Variable | High |
| Saline Intrusion Risk | Low | Possible | Low |