Implementing an Effective Training Matrix for Onshore Support: Driving Sustainable Business Models
Siti Amirah Othman*
Mohd Rosdi Mohamad Rejab
Faculty of Artificial Intelligence, Universiti Teknologi Malaysia
Competencies, skills and knowledge in performing individual tasks are vital in ensuring business sustainability. However, the impact of these valuable elements is frequently diminished by the lack of an effective training program, which often hides behind the success of cost optimization by the management. This research aims to highlight the necessity of effective training domains and propose the incorporation of the discovered training domains into the current training matrix. The primary goal of this research is to enhance the existing training matrix in parallel with changes in critical domains of the business model. A quantitative research design via questionnaire survey method was selected for this research. The respondents were among 100 employees in onshore support division including the technical services, support service, and operation departments. The research employs DATAtab and performing multiple linear regression to conduct analysis. The finding revealed that project management related training domain is the most significance variable contributing to the business sustainability objectives. This research outcome is expected to assist top management in Oil & Gas companies, specifically in the onshore division, in gaining a better understanding of the identification of additional domains that can be incorporated into the current training matrix to address business sustainability.
Keywords: Training matrix; sustainable business model; onshore support; oil and gas
Human resources are critical to the success of any business. The management of human resources in businesses must be professional to maintain a balance between employee needs and the organizational demands of the company, (Nasir S. Z., 2017). Humans possess reasoning, emotions, knowledge, skills, and abilities that significantly impact the efficiency and effectiveness of their company’s activities. As a labour factor, humans can grow and develop properly, (Piwowar-Sulej, 2020). In general, human resource development is defined as the integrated use of training and development, career pathways, and organizational design to improve individual and organizational effectiveness, (Sims, 2006). In an era of increasing globalization and intense competition, organizations face the imperative to adapt to changes and capitalize on emerging opportunities and challenges. Companies that aim for outstanding results and successful employee collaboration must promptly enhance performance through well-directed and planned employee development, (M. Ángeles López-Cabarcos, 2022). One significant factor shaping the future business environment, particularly for oil and gas-related industries, is the anticipated decrease in demand for fossil fuels and concerns about climate change effects, (McGlade, 2015). Oil and gas businesses, especially those involved in offshore activities, must adjust their operational models to navigate current and future market dynamics and maintain a competitive edge, (Semieniuk, 2022).
With expected alterations in the business environment, it becomes crucial to modify the current business model to ensure future sustainability, (Lu, 2022; McGlade, 2015; Semieniuk, 2022). This modification involves adopting a novel strategy, starting with collaboration with organizations offering advanced technology solutions in the operation and maintenance sector. Strengthening customer relationships and business networking aims to enhance service visibility to end-users, expanding the customer segment beyond offshore oil and gas businesses. Effective management aligned with sustainable business models is essential for a company’s long-term prosperity. To integrate a learning culture aligned with the company’s goals and objectives, changes to the existing training matrix are necessary. The business model alterations serve as a reference point.
It was anticipated that the business environment would undergo a significant transition in the next few years following the energy transition. All oil and gas-related companies should recognize that continuously enhancing the value of their workforce improving competency, abilities, and attitude is crucial for maintaining competitiveness (Zhiyuan Fan, 2021). This proactive approach, focusing not only on current requirements and customer segments but also anticipating future needs, is essential. Lack of assessment in training and development programs is an identified issue in the management system. Businesses must understand that the evaluation process is crucial for ensuring program effectiveness, leading to the successful accomplishment of a sustainable business model aligned with the company’s vision and mission, (Peter H. Rossi, 2019).
Since the great recession of December 2007 to June 2009, crude oil prices have experienced continuous fluctuations, (Javier Ordóñez, 2021). As a result, companies in the oil and gas industry have sought ways to reduce operating expenses Ugolo et al., (2019). Optimization efforts have impacted human resource management, particularly in training and development programs. Many organizations have reduced spending on extensive human resource development in favor of programs focusing on health, safety, environment (HSE), and job-related requirements, (Nyameboame, 2017). However, this approach, overly focused on industry requirements and cost optimization, overlooks critical loopholes in the training program that could jeopardize future sustainability.
Having employees aware of their work quality, company goals, and committed to efficient group performance is vital for both short-term and long-term business success, (Awadh, 2013). Lack of understanding regarding senior management’s development program and strategy can hamper employee motivation and trust in organizational development. In the oil and gas industry, management practices tend to conceal development objectives, claiming it’s necessary for data security, (Inkpen, 2019). This misalignment leads to a lack of employee effort synchronization with organizational goals. Employees’ feedback on existing training and development programs may remain unheard, potentially leading to future work execution failures. A similar situation occurs in O&G organization management, where the alignment of the training matrix with the current business plan may not have been effectively communicated to employees. If not addressed appropriately, this issue could gradually impact the quality of deliverables.
Research Objectives
The objectives of the research are:
RO1: To identify the gap in the current training matrix to align with the sustainable business model.
RO2: To suggest new domains in the current training matrix that align with the sustainable business model.
RO3: To propose a new guideline for training and development program towards sustainable business model.
Training & Development and Business Model
The primary goal of any business organization is to achieve sustainability from an economic survival perspective, ensuring continuous success and the fulfillment of its vision and mission, (Beattie, 2022). Despite this objective, many businesses face challenges in meeting their sustainability goals. Consequently, there’s a need for business model innovation to realign revenue mechanisms and leverage sustainable solutions effectively, (Wallin, 2019). Employee performance and deliverables are crucial factors that directly influence an organization’s performance management and sustainability, (Fechete F, 2019). Therefore, focusing on the business model becomes imperative in addressing sustainability. Employing proactive tactics can enable organizations to derive both short- and long-term benefits from sustainability initiatives, (Martin Geissdoerfer, 2018). However, many business model enhancements have failed, leading to severe economic repercussions for companies and substantial delays in the adoption of sustainable solutions. Employee performance, linked directly to the quality of training and development programs, has been identified as a contributing factor to the failure of implementing structured changes in an organization’s business model, (Garicano, 2016). An ineffective training and development program within any organization leading to poor employee performance and the failure of company deliverables is supported by several studies conducted by previous researchers. For instance, Anyanwu et al. (2016) conducted research in the Ministry of Finance in Nigeria, affirming the hypothesis that training and development significantly impacts worker productivity. The Figure 1 below illustrates the training cycle model proposed by Kirkpatrick illustrates the relationship between the business model or company goals at every stage of the training cycle and process.
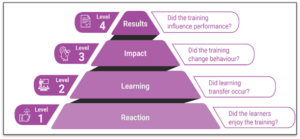
Figure 1. Kirkpatrick’s Training Evaluation Model (Kirkpatrick, Donald L.1994)
It becomes evident that at stage four of this training model, a thorough check and balance on the training design is necessary to ensure program effectiveness, which is essential for the business model, (Smidt, 2009). Several studies from the Asian continent have shed light on the issue of operational performance resulting from inadequate research, while general studies emphasize the crucial role of proper training for organizational employees in successfully implementing technological advancements in business, (Dubey, 2019; Saradhi Motamarri, 2020). According to research, many businesses experience a loss of competency due to operational flaws in their efforts towards business sustainability, (Nripendra P. Rana, 2021). Recent studies and expert observations in Malaysia further support the assertion of a direct relationship between training and company performance. A study by Surbaini (2018) demonstrates a strong correlation between these two factors, referencing the conclusion of Wehnam Peter Dabale’s study (2014) that training alters employee behavior to achieve organizational objectives and bridge performance gaps. Additionally, a recent poll by Skillsoft indicates that over seven out of ten workers in Malaysia are concerned about not receiving appropriate training for future professions. Furthermore, findings from a study conducted by a corporate learning services provider reveal that a majority of employees feel their current employers inadequately assist them in developing skills to meet future employment requirements, (Jaafar, 2019).
Technology Advancement and Customer Relationship Management
When examining the training domains to be incorporated into the training matrix, it is crucial to identify the additional elements introduced in the new sustainable business model. Figure 3 illustrates several new elements in the business model compared to the previous model depicted in Figure 2.
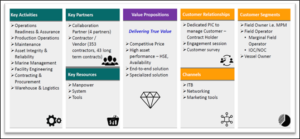
Figure 2. 2013 – 2021 EPOMS Business Model
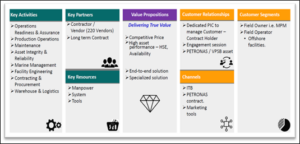
Figure 3. 2022 New Sustainable Business Model
These additions include incorporating numerical metrics into contract or vendor management, fostering collaboration with partners to advance technology in service provision, and enhancing flexibility in serving various customer segments. In contrast, the previous model primarily focused on core capabilities and competitive advantages, particularly in offering services at competitive prices, albeit with a narrower customer segment limited to offshore facilities. The strategic focus is evident in leveraging technological advancements through collaborative efforts as a business strength and adapting customer segmentation to ensure sustained demand for offered services. Embracing technological advancements and partnering with key technology providers in the company’s core business performance constitute solid strategies for enhancing the company’s capabilities and competitive advantages, (Marcinkowski, 2019). The integration of technology is central to business model innovation (BMI), which involves transforming business models to foster advancement, competitiveness, and differentiation in the pursuit of sustainability, (Dymitrowski, 2021). Augmented technology profoundly influences companies’ business practices, extending product and service life cycles while enhancing competitiveness, (Gruia et al., 2020). Additionally, it inherently introduces new learning and specialized training methodologies tailored to specific industry operations, (Kulkov et al., 2021). Customer relationship management (CRM) emerges as another critical domain in a sustainable business model. CRM entails researching market behavior and addressing the needs of current and potential customers or clients. The dynamic nature of customer behaviors and expectations renders the market volatile, emphasizing the necessity for companies to adapt to evolving market trends to survive, (Sulemana, 2020). To ensure the success of the envisioned business model, the company must prioritize targeted employee training to strengthen this domain, (Guerola-Navarro, 2022).
Project Management
Beyond technical proficiency and experience, it’s increasingly recognized that the cultivation of critical thinking and softer skills is pivotal for effective project management, (Ives, 2005). These softer parameters encompass interpersonal and leadership competencies significantly contribute to achieving desired project outcomes. Despite some businesses heavily relying on academic qualifications and experience to gauge project success, the oversight of other critical factors such as soft skill development and modern managerial practices is common, (Reilly, 2003). Neglecting these aspects hampers the potential for enhanced success and more efficient project management. Hence, it’s imperative for companies to acknowledge and embrace the significance of soft skills and modern management practices to foster business continuity and achieve sustainable goals, (Xu, 2020).
Furthermore, research underscores the positive influence of soft skills and modern management competencies on project outcomes, (Magano, 2020; Wong, 2020; and Zuo, 2018). Effective communication, teamwork, adaptability, and conflict resolution exemplify soft skills crucial for project execution. Additionally, leadership attributes such as the ability to motivate teams, facilitate decision-making, and navigate complexities are pivotal for project success, (Randhawa, 2017). Integrating these abilities into project management practices facilitates a more comprehensive approach, enabling companies to operate with greater effectiveness and efficiency.
Moreover, acknowledging soft skills and modern management competencies aligns with the evolving dynamics of the business landscape. The contemporary business climate is characterized by rapid technological advancements, globalization, and increased collaboration among diverse stakeholders. These dynamics necessitate a departure from conventional, rigid project management approaches towards more adaptive strategies, (Kaul, 2019). By valuing and nurturing these skills alongside educational backgrounds and experience, businesses can enhance project outcomes, promote efficient management practices, and ensure business continuity amidst ever-changing business landscapes, (Obradović, 2019).
Supply Chain Management (SCM)
The effective oversight of supply chains is crucial for businesses striving to create a more sustainable future, (Brandao, 2022). Integrating CRM and SCM techniques can streamline workflows and enhance operational efficiency, (Taleghani, 2022). A robust CRM-SCM integration relies on workforce capabilities, ensuring businesses have the necessary materials, knowledge, and financial resources to deliver exceptional products and services meeting customer demands promptly, (Deng, 2022).
Efficient supply chain management not only eliminates internal and external conflicts but also enhances customer satisfaction through improved productivity, (Brandao, 2022). Managing the flow of work from suppliers to manufacturers, and then to distributors and retailers when required, is paramount. Establishing strong connections with support suppliers and contractors provides valuable insights into product availability and pricing, enabling businesses to operate profitably. Integrating CRM and SCM with key partners, such as suppliers, can significantly save time, effort, money, and resources, (Deng, 2022). This underscores the importance of empowering SCM-related competencies to achieve company sustainability goals.
Operation and Maintenance (O&M)
Continuous improvement of training programs and competencies in the realm of operation and maintenance is imperative to maintain competitiveness and adapt to evolving market demands. As noted by Mohammed et al. (2020), the effectiveness of training programs is critical in the oil and gas industry to enhance operational efficiency, minimize downtime, and maximize productivity. Regular evaluation of training effectiveness is necessary to pinpoint areas for enhancement and bridge any existing knowledge and skill gaps, (Russo, 2020). Neglecting to address these gaps can result in diminished operational performance and hindered capacity to meet industry standards and customer expectations, (Krogstie, 2019). Therefore, organizations must prioritize continual improvement of training programs to uphold a skilled workforce and achieve sustainable objectives.
It is essential to extend the scope beyond traditional operations and maintenance services confined to the oil and gas facility industry to broaden capabilities in facility operations and maintenance. Diversifying into new market segments, such as onshore projects, presents numerous expansion opportunities. Conducting an assessment of necessary changes in the training matrix is essential to ensure that employees are adequately prepared for these shifts, (Layto, 2018).
Oil & Gas Business Awareness and Current Situation
Employee awareness of business goals plays a crucial role in aligning job execution and facilitating necessary adjustments within a company or organization, (Juliana Raupp, 2010). Lack of awareness regarding the importance of information and direction within the organization can sometimes impact operational costs and business success, (Ahmed and Thitivesa, 2020). Farnese (2020) emphasized the detrimental effects of poor communication on organizational orientation and job failures.
Maintaining privacy is paramount for a business’s success and longevity, providing a competitive edge in a landscape fraught with threats of confidential information theft and misuse, (Lippoldt, 2014). The Malaysian government is actively developing policies to safeguard innovation within the high technology business sector. Companies like PETRONAS enforce strict confidentiality clauses in their codes of conduct, prohibiting the use or disclosure of private information, (PETRONAS, 2022). Recent developments, such as the transfer of shares in EPOMS Sdn Bhd by Petronas Carigali Sdn Bhd (PCSB), highlighted the importance of organizational continuity and its potential impact on internal communication and employee awareness (Khalid, 2022).
Work discipline, characterized by adherence to established rules and regulations in the workplace, is crucial for organizational effectiveness, (Treshia, 2018). Leaders play a pivotal role in fostering employee awareness through their attitudes and leadership styles, (Banks, 2016). Failure to enforce discipline and instill a sense of responsibility among employees can hinder awareness of organizational changes, leading to suboptimal outcomes, (Yanqing Lai, 2016). Additionally, the satisfaction and seniority of employees influence their awareness levels regarding company changes, (Christina Bodin Danielsson, 2019). Given the subjective nature of employee attitudes and their impact on organizational awareness, further research is warranted to identify underlying issues affecting the training matrix and organizational awareness.
Improvement of Training Matrix
The effective use of a training matrix is essential for tracking employee training needs and programs to meet business requirements, (Alison, 2022). Failure to value training management and recognize the potential benefits of improved employee knowledge and skills is a primary cause of training system failure, (Tom Short, 2010). If the company’s sustainability management prioritizes technology enhancement, training employees in the selected technology application should be a primary focus, (Dial, 2020; Janes O. Samwel, 2018). Technological implementation competency and expertise ensure technology enhancement remains a source of competitive advantage in the future. According to a study by Vitorino Filho (2018), training related to adapted technology capabilities should be a crucial domain in the training matrix to ensure expertise in technologies as a company strength. Top management should appropriately identify and select required training details, seeking input from employees to maximize efficiency.
Training Matrix Gap Identification
A document gap analysis was conducted on EPOMS-HSE-G11 HSE Training Guideline Revision 1, based on recommendations from relevant literature reviews. The ideal state was established by reviewing documents such as the PetroSkill 2021 Oil and Gas Facilities and Midstream Training and Development Guide and the Industrial Skills Framework for Oil and Gas Energy by Petronas, which provide comprehensive training lists for all facets of the oil and gas industry. Additionally, documents pertaining to training records and comprehensive training initiatives, such as the BTEC (Business and Technology Education Council) Competency Programme and CLIPSE (Competence Leading Programme Standard for Engineers), were reviewed to provide evidence for the training gap analysis. The comparison in Table 1 highlighted major gaps that can be further narrowed down in the next step of this research to identify the most crucial domain for organization to adopt in addressing the sustainability goals outlined in the sustainable business model.
Table 1. EPOMS-HSSE-G11 Gap Analysis Table
| Section | Ideal State | Gap | Current State |
| Purpose and Objective | To serve HSSE, Job requirement and sustainability of business | To specific and not addressing additional domain as company competitive advantage. | Covered all HSSE requirement |
| Identification of training Needs | Efficient Training Matrix | No specific guidelines | Minimal training provided via ad hoc request from functional Manager. |
|
Essential Training Domain
|
HSSE | Training Record Available and no identified gap.
· Training record · HSSE training Guidelines
|
· HSSE Training record keeping in place.
· HSSE Training Guidelines in place. · Training provided accordingly |
| Project Management | Not Available
· Job conducted based on employee experiences, · No recorded Training for onshore support division |
· No Guidelines for Project Management Training.
· Not specified in training Matrix |
|
| O&G Business Awareness | Not Available
· Job conducted based on employee experiences, · No recorded Training for onshore support division |
· No Guidelines for O&G Business Awareness Training.
· Not specified in training Matrix · No Training Record |
|
| O&M | Training record available and no identified gap.
· CLIPSE Program · API training Record. · BTEC Competency Program |
· Training record in place
· Guidelines and top documents available. |
|
| Supply Chain Management (SCM) | Not Available
· Job conducted based on employee experiences, · No recorded Training for onshore support division |
· No Guidelines for Supply Chain Management.
· Not specified in training Matrix · No Training Record. |
|
| Engineering Specific | No recorded Training for onshore support division
· Job conducted based on employee experiences, · No recorded Training for onshore support division |
· There is available record of sufficient training.
· Only to be enhanced in new Training Matrix. |
Sample size refers to the number of individuals included in a study to accurately represent a larger population. In this stage of the research, a guideline derived from Krejcie and Morgan’s table Krejcie, (1970) was utilized to determine the appropriate sample size . In accordance with the details of the table, a convenient non-probability sample was chosen to take part in the research survey. E&P O&M Services Sdn Bhd’s (EPOMS) onshore support division has 100 employees consist of technical services department, support service department and operation department. The mentioned population will be utilised to administer questionnaires. The stated population were chosen because they are the central to EPOMS operational business activities and have constant interaction with current and prospective customers or clients.
Based on the details highlighted in the review of relevant literature and the document gap analysis exercise, the next step in this research is to identify the most crucial domains that will significantly influence the effectiveness of the training matrix. It is essential to pinpoint the most effective domain that aligns with organization’s sustainability goals while also being compatible with the company’s commercial objectives. To analyze the selected subject, software analysis is crucial, and the use of statistical tools is mandatory. The quantitative research method through questionnaire survey is the primary approach to meet the requirements. In addition, this method was chosen to gain deeper insights into the training and development program requirements for the target sampling participants to align with the sustainable business model.
The analysis of the collected data has been performed using the DATAtab online statistical calculator. The questionnaire comprises two sections containing a total of 26 questions. The first section aims to gather demographic information such as age, gender, race, duration of work experience, working department, and rank. The second section focuses on assessing the strength of the relationship between the dependent variable and independent variables to draw conclusions addressing the significance of the research. All questions in the second part were evaluated using a 5-point Likert scale, with points assigned as follows: 5 for “Strongly agree,” 4 for “Agree,” 3 for “Neutral,” 2 for “Disagree,” and 1 for “Strongly disagree.” Descriptive statistics were used to determine the independent variables, with results drawn from both secondary and primary data sources. The majority of the results are based on secondary data. This research will employ descriptive statistical analysis, and all quantitative questionnaire responses have been summarized in Table 2 for further analysis.
Table 2. Descriptive Statistic
| Domain | Number of Samplings (N) | Mean | Standard Deviation | Variance |
| SBM Training Matrix (M1)
|
86 | 4.73 | 0.66 | 0.43 |
| SBM Training Matrix (M2)
|
86 | 4.81 | 0.47 | 0.22 |
| SBM Training Matrix (M3)
|
86 | 4.66 | 0.94 | 0.88 |
| SBM Training Matrix (M4) | 86 | 4.86 | 0.35 | 0.12 |
| Project Management (P1)
|
86 | 4.64 | 0.88 | 0.77 |
| Project Management (P2)
|
86 | 4.57 | 0.68 | 0.46 |
| Project Management (P3)
|
86 | 4.22 | 0.49 | 0.24 |
| Project Management (P4)
|
86 | 4.8 | 0.40 | 0.16 |
| Supply Chain Management (S1)
|
86 | 4.65 | 0.57 | 0.32 |
| Supply Chain Management (S2)
|
86 | 4.64 | 0.61 | 0.37 |
| Supply Chain Management (S3)
|
86 | 4.78 | 0.44 | 0.20 |
| Supply Chain Management (S4)
|
86 | 4.81 | 0.42 | 0.18 |
| O&G Business Awareness (O1)
|
86 | 4.45 | 0.5 | 0.25 |
| O&G Business Awareness (O2)
|
86 | 4.26 | 0.49 | 0.24 |
| O&G Business Awareness (O3)
|
86 | 4.36 | 0.48 | 0.23 |
| O&G Business Awareness (O4)
|
86 | 4.22 | 0.42 | 0.17 |
| Technological Advancement (T1)
|
86 | 4.60 | 0.49 | 0.24 |
| Technological Advancement (T1)
|
86 | 4.16 | 0.40 | 0.16 |
| Technological Advancement (T1)
|
86 | 4.91 | 0.29 | 0.09 |
| Technological Advancement (T1) | 86 | 4.91 | 0.29 | 0.09
|
Demographic Profile of the Respondents
Out of the 100-target population, 86 participants responded to the questionnaire. Males accounted for 76.6% of the sample, while females represented 23.4%. Regarding the age distribution, 37.2% of respondents were aged between 30 and 41, 36% between 41 and 50, 12.8% between 20 and 31, 9.3% between 51 and 60, and 4.7% were over 61. This study encompassed all of the staff in offshore support divisions and achieved a high participation rate. Among the participants, 39.5% were junior executives, while 20.9% were at the managerial level, 24.4% were senior executives, and 15.1% were non-executive participants. Regarding years of experience, those with over eight years accounted for 53.5%, while those with five to eight years represented 17.4%, those with three to five years made up 16.3%, and those with less than two years comprised 12.8%. The Sankey diagram in Figure 5 below provides a summary of the collected demographic profile for this research.
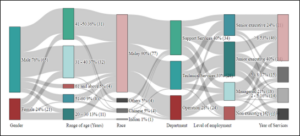
Figure 4 Sankey Diagram for Research Population
Data Reliability Assessment
The output data from the questionnaire responses were evaluated using a reliability test to assess their accuracy and reliability. According to Pallant, (2001), data are considered credible and acceptable if the value of Cronbach’s Alpha exceeds 0.70. The results of the reliability test for this research are presented in Cronbach Alpha assessment tables. The findings indicate a reliable relationship between each variable and the Cronbach’s Alpha values, all of which were above 0.70. For further statistical analysis, the survey output with the highest reliability and the most significant influence on the Cronbach’s Alpha value will be selected to ensure that the data used in the regression analysis are of higher quality and provide a more accurate representation of the independent variable, (Robert M. Groves, 2004). Further details and a summary of Cronbach alpha calculations for each variable are provided in the analysis summary below.
Table 3. Cronbach’s Alpha for Dependent Variable
| Dependent variables:
SBM Training Matrix
Cronbach’s Alpha |
Items |
| 0.76 | 4 |
Table 4. Statements and Cronbach’s Alpha Value for Dependent Variable
| Statements | Corrected Item-Total Correlation | Cronbach’s Alpha if Item Deleted |
| M1: I believe I need additional training that is relevant to the deliverables of my job. | 0.66 | 0.65 |
| M2: I believe ongoing training is able to enhance my skills and knowledge to effectively fulfil my job responsibilities. | 0.71 | 0.67 |
| M3: I believe management should improve the current training matrix so that it aligns with the company’s performance and future plans. | 0.56 | 0.79 |
| M4: I believe that management should revise the current training matrix to ensure the long-term viability of the company. | 0.61 | 0.74 |
The Cronbach alpha coefficient for these items was found to be 0.76, indicating a satisfactory level of internal consistency among the items. Individual item-total correlations were also examined to determine the strength of each survey feedback item’s relationship with the overall construct. The results showed that M1 had a total correlation of 0.66, indicating a moderately strong relationship with the dependent variable. Similarly, M2 demonstrated a higher correlation of 0.71, suggesting a stronger association. M3 exhibited a correlation of 0.56, indicating a moderate relationship, while M4 showed a correlation of 0.61, indicating a moderately strong relationship with the dependent variable. These findings suggest that the survey feedback items overall are internally consistent and contribute to measuring the intended construct. However, M2 appears to have the highest correlation with the dependent variable, indicating it may be the most reliable and influential item for assessing the construct.
Table 5. Cronbach’s Alpha for First Independent Variable
| Independent variable:
Project Management
Cronbach’s Alpha |
Items |
| 0.83 | 4 |
Table 6. Statements and Cronbach’s Alpha Value for First Independent Variable
| Statements | Corrected Item-Total Correlation | Cronbach’s Alpha if Item Deleted |
| P1: I believe that additional training is necessary to effectively administer and manage the current projects. | 0.73 | 0.76 |
| P2: I believe that relying solely on my work experiences will not be sufficient to meet the future demand of project management effectively. | 0.7 | 0.78 |
| P3: I believe that the current arrangement for project management-related training can be enhanced to better facilitate my work. | 0.7 | 0.77 |
| P4: I believe that additional investment and continuous development in project management skills are essential to stay updated with industry best practices. | 0.59 | 0.83 |
The internal consistency and reliability of the survey feedback related to the first independent variable were evaluated using Cronbach’s alpha. The calculated Cronbach’s alpha coefficient for these four surveys feedbacks was 0.83, indicating a high level of internal consistency among the items. To further assess the relationship between each survey feedback item and the underlying construct, item-total correlations were examined. The results revealed that P1 exhibited a total correlation of 0.73, indicating a strong positive relationship with the independent variable. Similarly, both P2 and P3 demonstrated correlations of 0.70, indicating a high level of association. P4 showed a slightly lower correlation of 0.59, indicating a moderate relationship with the independent variable. Overall, these findings indicate that the survey feedback items have good internal consistency and contribute to measuring the intended construct for the first independent variable. The high Cronbach’s alpha value of 0.83 provides further support for the reliability of the survey feedback as a measurement tool.
Table 7. Cronbach’s Alpha for Second Independent Variable
| Independent variable:
Supply Chain Management
Cronbach’s Alpha |
Items |
| 0.75 | 4 |
Table 8. Statements and Cronbach’s Alpha Value for Second Independent Variable
| Statements | Corrected Item-Total Correlation | Cronbach’s Alpha if Item Deleted |
| S1: I believe that the improvement of supply chain management (SCM) can be achieved through company-sponsored training and development programmes. | 0.57 | 0.67 |
| S2: I believe that the current supply chain management (SCM) training programme for all employees can be enhanced to sustain the company’s competitive advantages in the future | 0.55 | 0.69 |
| S3: I believe that investing in training programs focused on supply chain management (SCM) for employees outside the supply chain department would enhance cross-functional collaboration an improve overall efficiency. | 0.62 | 0.66 |
| S4: I believe that acquiring training in supply chain management (SCM) would enhance my ability to identify and mitigate supply chain risks that have an impact on our company’s sustainability. | 0.47 | 0.73 |
The calculated Cronbach’s alpha coefficient for these four survey items was 0.75, indicating a satisfactory level of internal consistency among the items. To further examine the relationship between each survey feedback item and the underlying construct, item-total correlations were analyzed. The results revealed that S1 exhibited a total correlation of 0.57, indicating a moderately positive relationship with the independent variable. Similarly, S2 demonstrated a correlation of 0.55, also suggesting a moderate level of association. S3 showed a slightly higher correlation of 0.62, indicating a moderately strong relationship. Lastly, S4 exhibited a correlation of 0.47, indicating a moderate relationship with the independent variable. Based on these findings, the Cronbach’s alpha value of 0.75 indicates that the survey feedback items for the second independent variable exhibit acceptable internal consistency and reliability. We can use these survey feedback items with confidence when assessing the second independent variable. However, it is important to note that S3 had the highest correlation, indicating it may be the most influential item for measuring the construct.
Table 8. Cronbach’s Alpha for Third Independent Variable
| Independent variable:
O&G Awareness
Cronbach’s Alpha |
Items |
| 0.71 | 4 |
Table 9. Statements and Cronbach’s Alpha Value for Third Independent Variable
| Statements | Corrected Item-Total Correlation | Cronbach’s Alpha if Item Deleted |
| O1: I believe that my knowledge of the current and future predictions of the oil and gas industry in Malaysia and around the world is valuable to company. | 0.39 | 0.71 |
| O2: My awareness in the oil and gas business can be developed through self-initiative (general reading and social media). | 0.42 | 0.69 |
| O3: I believe that the required training in oil and gas business awareness is essential for the long-term sustainability of our company. | 0.51 | 0.63 |
| O4: I believe prioritizing oil and gas business awareness training is crucial for long-term success, outweighing short-term cost concerns. | 0.69 | 0.53 |
The calculated Cronbach’s alpha coefficient for these four items was 0.71, indicating a satisfactory level of internal consistency among the items. Examining item-total correlations further explored the relationship between each survey item and the fundamental construct. The correlation coefficient between O1 and the independent variable was 0.39, indicating a modestly positive relationship. Similarly, the correlation of O2 was 0.42, indicating an insignificant association. O3 displayed a correlation coefficient of 0.51, indicating a moderate relationship. Finally, O4 showed a correlation of 0.69 with the independent variable, indicating a moderately strong relationship. While the total Cronbach’s alpha value of 0.71 indicates acceptable internal consistency, it is important to note that the survey responses for the third independent variable display varying degrees of correlation with the construct.
Table 10. Cronbach’s Alpha for Fourth Independent Variable
| Independent variable:
Technological Advancement
Cronbach’s Alpha |
Items |
| 0.75 | 4 |
Table 11. Statements and Cronbach’s Alpha Value for Fourth Independent Variable
| Statements | Corrected Item-Total Correlation | Cronbach’s Alpha if Item Deleted |
| T1: I believe that the company should increase its investment in providing training on the latest technology advancements for business development. | 0.32 | 0.86 |
| T2: I believe that investing in competency development programmes focused on technological advancements will yield significant financial returns for the organisation. | 0.46 | 0.74 |
| T3: I believe employee expertise in technological advancement will become a key component of a company’s competitive advantage. | 0.82 | 0.58 |
| T4: I believe that knowledge and competency in the latest technological advancements will help companies sustain themselves in the future. | 0.82 | 0.58 |
The Cronbach alpha coefficient was calculated to evaluate the internal consistency of the four-variable survey response data (T1, T2, T3, and T4). A Cronbach alpha coefficient of 0.75 indicates a moderate to high level of internal consistency among the variables. This suggests that the items within each variable measure the same underlying construct reliably. In addition, the individual variables’ inter-item correlations were as follows: T1 (0.32), T2 (0.46), T3 (0.82), and T4 (0.82). T3 and T4 have greater inter-item correlations than T1 and T2 do. These results indicate that the survey response data has satisfactory internal consistency and can be relied upon for additional analysis and interpretation.
Regression Analysis
In this final multiple linear regression analysis, the most influential independent variables P1, S2, O3, and T1 on the dependent variable M3 were investigated. According to the regression model, these variables accounted for 26.01% of the variance in M3. With an F-value of 7.21 (p .001) and an R-squared value of 0.21, the ANOVA test confirmed that this effect was statistically significant.
Table 12. Model Summary M3 and P1, S2, O3, T1
| Model Summary
R |
R2 | Adjusted R2 | Standard error of the estimate |
| 0.51 | 0.26 | 0.22 | 0.32 |
| ANOVA | |||
| ANOVA Model | df | F | p |
| Regression | 4 | 7.21 | <.001 |
Table 13. Summary Analysis of the Standardised Regression Coefficients for P1, S2, O3, T1
| Unstandardized Coefficients |
Standardized Coefficients |
95% confidence interval for B | |||||
| Model | B | Beta | Standard error | t | p | lower bound | upper bound |
| (Constant) | 2.59 | 0.64 | 4.06 | <.001 | 1.32 | 3.85 | |
| T1 | 0.3 | 0.49 | 0.06 | 5.18 | <.001 | 0.18 | 0.41 |
| T2 | 0.07 | 0.12 | 0.06 | 1.22 | .227 | -0.04 | 0.18 |
| T3 | 0.06 | 0.08 | 0.07 | 0.81 | .421 | -0.09 | 0.21 |
| T4 | 0.06 | 0.08 | 0.07 | 0.88 | .383 | -0.08 | 0.21 |
The coefficients of regression produced the following model: M3 = 2.59 + 0.33 P1 + 0.07 S2 + 0.06 O3 + 0.06 T1.
When all independent variables are equal to zero, M3 is predicted to have a value of 2.59. The coefficients represent the change in M3 caused by an increase of one unit in each respective independent variable. An increase of one unit in P1 corresponds to a 0.3 increase in M3, whereas an increase of one unit in S2, O3, and T1 results in increases of 0.07, 0.06, and 0.06, respectively. By analyzing the standardized regression coefficients (beta), it is possible to determine that P1 has the greatest impact on M3 within the model. P1, S2, O3, and T1 had p-values of .001, 0.227, 0.421, and 0.383, respectively. The p-value for P1 was less than the significance threshold of 0.05, indicating that the population coefficient for P1 differs significantly from zero. However, the coefficients for S2, O3, and T1 were not substantially different from zero. The multiple linear regression analysis revealed that variables P1, S2, O3, and T1 accounted for a substantial proportion (26.01%) of the variance in M3. Particularly, P1 exerted the greatest influence on M3. Therefore, P1 is an essential indicator of M3, whereas S2, O3, and T1 may have limited predictive value in this model.
Based on the results of the multiple linear regression analysis, the research has provided valuable insights into the relationship between the independent variables: P1 representing the need for project management-related training, S2 representing the need for project supply chain management-related training, O3 representing the need for oil and gas awareness-related training, and T1 representing the need for technological advancement-related training, and the dependent variable M3 representing an effective training matrix. These variables explain a significant proportion (26.01%) of the variance in M3, according to the findings. P1 emerged as the most influential variable, indicating its significance in predicting and addressing business sustainability objectives. This matrix should be designed to align with the company’s performance and business plan, taking employee input on the variables into account. Specifically, additional training in the identified domains can be added to the matrix to address the company’s business sustainability objectives. To enhance the effectiveness of the training programme, management should address employees’ concerns regarding the need for additional project management training, improve the supply chain management (SCM) training programme, provide training on oil and gas business awareness, and incorporate training on the most recent developments in technology for business development. By incorporating these domains into the training matrix, organization can better equip its employees to achieve the sustainability goals outlined in the most recent business plan. To address the commercial optimisation initiative, however, non-drastic changes in training regimens and a gradual improvement of the training matrix can be implemented by referring to appropriate guidelines, particularly the results of relevant research.
It is essential to note that the target population for this research was the onshore support department, and the research attempted to identify additional domains that could be incorporated into the training matrix to address the company’s business sustainability objectives. To further validate and generalize the findings, it is suggested that comparable studies be conducted in other company departments or sectors, or that the research be expanded to include a wider range of stakeholders in the industry. This would provide a more comprehensive comprehension of the factors influencing an effective training matrix and permit the development of an organization-wide training programme that is holistic and effective. The results of the regression analysis indicate that among the independent variables, P1 (need for project management-related training to administer project management) has the greatest impact on the dependent variable M3. This finding suggests that the inclusion of additional domains in the training matrix should prioritize project management-related training to improve project administration. The participant feedback emphasizes the need for additional training to effectively administer and manage current and future projects, highlighting the significance of P1 in achieving the business sustainability objectives of the company. The relationship between company success and this outcome is supported by the fact that oil and gas service providers rely heavily on project income from engaged clients. Therefore, effective project management is considered necessary for ensuring the success of current projects and establishing a solid track record in project management as bait for future project engagement.
Although the independent variables S2, O3, and T1 also contribute to the explanation of the variance in M3, their impact appears to be relatively minor compared to that of P1. The statistical calculation demonstrated a less significant influence, the management must still consider a staggered development in training related to these variables. The consistency of questionnaire responses indicated that the majority of participants agreed with the need for training on these three variables. The relevant literature also emphasizes the significance of their improvement. Perhaps the training programme’s limitations and development can be staggered to accommodate the company’s budget and operational requirements. This will ensure that the training matrix effectively enhances employee skills and knowledge in crucial areas for achieving the company’s sustainability goals without exposing the company to a high level of commercial risk. By prioritizing P1 and customizing the training programme to address the identified deficiencies in project administration and management, organizations can enhance its employees’ abilities to drive successful project outcomes and contribute to the company’s sustainability. While contemplating the other variables for potential improvements to the training matrix, it is essential to prioritize resources and efforts so as to reflect their relatively lower influence on M3, as suggested by the results of the regression analysis. Implementing these recommendations will assist in aligning its training initiatives with the company’s performance and future plans, resulting in a more effective training matrix that contributes to the accomplishment of business sustainability goals. Regular evaluation and modifications based on employee and client feedback can enhance the training programme’s relevance and impact the organization’s overall success.
The findings of this study contribute to the existing body of knowledge by illuminating the relationship between independent variables representing different training needs (P1, S2, O3, and T1) and the dependent variable (M3) representing an effective training matrix. Through multiple linear regression analysis, it was determined that these variables account for a substantial proportion (26.01%) of the variance in M3. Notably, P1 emerged as the most influential variable, emphasizing its importance in predicting and achieving business sustainability goals. This study enhances our comprehension of the significance of project management training for success, especially in project-based industries such as oil and gas services. It emphasizes the importance of prioritizing project management training to improve project outcomes and establish a firm track record. Additionally, the study suggests incorporating additional training domains, such as supply chain management, oil and gas awareness, and technological advancement, to develop a comprehensive training strategy for sustainable business model. Future researchers may conduct comparable studies in various company departments or industries, as well as involving a broader range of industry stakeholders, demonstrates the need for additional research to validate and generalize the findings.
This work was funded by Universiti Teknologi Malaysia under the UTM Encouragement Research Grant Scheme, UTMER, Q.K130000.3856.31J05.
Ethical Considerations:
The UTM Research Ethics Committee (UTM REC) has provided ethical approval for this study in the Main Panel Meeting of Research Ethics Approval Bil 5/2024 dated 9th June 2024. Approval No.: UTMREC-2024-72
Conflict of Interest:
I hereby declare that we have no conflict of interest related to this matter
Authors:
Siti Amirah Binti Othman (corresponding author)
Faculty of Artificial Intelligence
Universiti Teknologi Malaysia
54100 Kuala Lumpur, MALAYSIA.
Mohd Rosdi Mohamad Rejab
Faculty of Artificial Intelligence
Universiti Teknologi Malaysia
54100 Kuala Lumpur, MALAYSIA.