Predicting Repair and Maintenance Costs for Five Tractor Makes in the Gezira Scheme (Sudan)
Lotfie A. Yousif1, and Shaker Babiker Ahmed2
1Agricultural Research Corporation (ARC), Agricultural Engineering Research Program, Wad Medani, Sudan
2Department of Agricultural Engineering, Faculty of Agriculture, Omdurman Islamic University, Sudan
Many tractor makes of two-wheel drive (2WD) types are working in the Gezira irrigated agricultural scheme, Sudan. Private individual farmers own most of them. However, information regarding their repair and maintenance costs are insufficient. Moreover, depending on information on repair and maintenance costs from other farming systems or countries is unrealistic. The objectives of this study were to develop power mathematical model to predict repair and maintenance costs for tractors make and their general model for tractors owned by individual private farmers in the Gezira irrigated scheme. The required data was obtained through structured questionnaire. The collected data included tractor make, model and initial purchase price, in addition, to tractor’s annual repair and maintenance expenses. Moreover, the annual working hours for tractors were calculated. Five tractors make were studied; namely Massey Ferguson (MF 290), New Holland (TT 75), Hattat 290, Tafe 8502 and John Deere (JD 5075E). Power models were developed for these tractors make and their general model. The results showed that there was strong and highly significant correlation between annual repair and maintenance cost as percentage of purchase price (y) and annual hours of use (x). The coefficients of determination (R2) were between 0.85 and 0.99 and the significance levels (P) were (P < 0.01 to 0.001) for all tractors make and the general model. The established power models were (y = 0.0007 x 0.7268), (y = 0.0026 x 0.5491), (y = 0.0009 x 0.7207), (y = 0.0042 x 0.4899), (y = 0.0001 x1.0136) and (y = 0.0011 x 0.6827) for MF 290, TT 75, Hattat 290, Tafe 8502, JD 5075E tractors make and their general model, respectively. The general model predicted lower values than those models in the Sudan and other countries. The results revealed that tractor purchase price and annual hours of use influenced repair and maintenance costs, but purchase price had great effect compared to hours of use. Models for predicting tractor repair and maintenance costs should be updated periodically to diminish the influence of the involved factors in calculations such as prices and usage as well as other factors like services received.
Key words: Tractors, power model, hours of use, purchase price, individual private farmers, Gezira scheme Sudan.
Improvement in agricultural productivity is the major challenge facing the developing countries (Nkakini and Etenero, 2019). Tractors and agricultural machinery have great effect on improving productivity, through proper and timely execution of farm operations. Possessing a tractor and machinery need special knowledge about their performance, operations schedule, annual use and cost calculations. Machinery cost comprises fixed and variable costs. The variable cost items include fuel, labor and repair and maintenance costs. In general, the cost other than those for repair and maintenance are usually decreases with increasing usage, but the reverse is true with the respect to repair and maintenance costs (Dahab, et al., 2021). Repair and maintenance costs are expenditure spend for spare parts and labor for installing replacement parts after parts failure and reconditioning some parts as a result of wear. Repair and maintenance costs include filters, lubricants and any other maintaining expenses. The expenses payed for repair and maintenance of a tractor are of special importance as they represent real portion of the total operation cost. Records keeping about these expenses is the key factor for exact calculations of repair and maintenance cost.
Tractors and machinery without proper maintenance and adequate management in farm operations would not result in a targeted increase in production (Nkakini and Etenero, 2019). However, any defect in tractor components would result in underutilization of its power and hours of use. Repair and maintenance costs differs broadly from one geographical location to another in the same country, due to the differences in soil, weather, crops condition, other variations due to the differences in the skill of operator and machine value (Lazarus, 2005).
Repair and maintenance costs represent an important portion of total cost of owning and operating farm machinery. They tend to increase with usage and age (Hunt, 1995). In addition, they influence the optimal time for tractor and machinery replacement. Moreover, repair and maintenance costs can’t be generalized due to variations in operating conditions, management of maintenance program and labor charges. Furthermore, they are difficult to estimate because accurate records of repair costs over the lifetime of machines are not readily available (Sabir, et al., 1990). As it is not easy to obtain exact monetary values of repair and maintenance costs due to inaccessibility or unavailability of good records, agricultural engineers use mathematical models as tools to predict these costs. There is a consensus, among researchers worldwide, that power model is the best model to predict repair and maintenance cost of tractor, because it is simple in calculations and gives better estimations (ASAE, 1989, Bakht et al., 2009, Khodabakhshina and Shakeri, 2011, Abubakar et al., 2013, Yousif, 2016, Dahab, et al., 2021). In contrast, Théodore, et al., (2017) and Dankyarana, and Umar (2020) mentioned that the polynomial model gave better cost prediction with higher confidence and less variation than other models. Ahmed et al., (1999) mentioned that the use of predictions of the developed countries to estimate repair and maintenance costs of tractors in developing countries would result in misleading estimates.
Although, some authors developed models to predict tractor repair and maintenance cost in the Sudan (Ahmed et al., 1999, Yousif, 2016, Dahab, et al., 2021), but these models were developed for agricultural areas other than Gezira irrigated scheme or many years elapsed after their development. Also, changes had happened in Sudan’s economy in recent years as indicated by the increased price of tractors and their spare parts. Furthermore, in the past decades the majority of tractors, if not all of them, which worked in the Gezira scheme were owned by public sector and private companies, but now several farmers in the scheme possessed and managed different tractors make. Now several tractors make are working in the Gezira scheme. This situation necessitate the development of models to predict repair and maintenance cost for tractors owned by private individual farmers in the Gezira scheme. Many tractor makes and models are working in the Gezira irrigated agricultural scheme, Sudan. Most of these tractors are of 70 to 80 hp power size and of the two-wheel drive (2WD) type. These tractors are used to perform several operations in the farms. However, there is inadequate information about the repair and maintenance costs. It was believed that providing reliable information about tractor repair and maintenance cost can help in tractor management.
Therefore, the objectives of this study were to develop power mathematical model to predict repair and maintenance cost for different tractors make and their general model in the Gezira scheme. In addition to compare, the developed general model with other models developed in the Sudan and elsewhere. Moreover, to test the response and sensitivity of the developed model to changes in repair and maintenance cost per hour due to the changes in tractor initial purchase price and annual hours of use.
Study area
The present study was carried out in the Gezira irrigated scheme. It is located in the central of Sudan in a semi-arid region, the soil is Vertisols, it covers about 2.2 million feddans (one feddan = 0.42 ha). Intensive network of different size of water channels are used to irrigate farms in the scheme. Farm holding size is about 20 to 40 feddans. Farmers have long experience in managing their farms. Five-course rotation is followed in the scheme, where 60% of the land is grown in summer season, 20% in winter season and the remaining is left fallow in a rotation. Several crops are grown in the scheme in summer and winter seasons. Individual farmers own tractors and machinery working in the scheme. The majority of these tractors were of 2WD type with power range between 75 and 80 hp. Tractors and machinery are intensively used for land preparation. The majority of the associated machines are mounted on the three-point hitch.
Data collection
A structured questionnaire was prepared for tractor owners in the Gezira scheme. They were asked about tractor make and model, age and initial purchase price. In addition, the questionnaire included data about tractor’s annual repair and maintenance expenses. Moreover, data on work rate and annual covered area by each implement accompanying the tractor were also acquired. 154 tractor owners were interviewed. Simple random sampling technique was followed. It is arduous to get to the required data from all respondents, specialty those related to repair and maintenance expenses. Five tractor makes were used in this study. These tractor makes were Massey Ferguson (MF 290), New Holland (TT 75), Hattat (Hattat 290), Tafe 8502 and John Deere (JD 5075E). All of these tractors were of two wheels drive (2WD), their engine power were between 73 and 82 hp. Table 1 illustrates similarity and differences in the some technical specifications of the tractors under investigation.
Table 1. Some technical specifications of the studied tractor makes in the Gezira scheme
| Tractor make/model | MF 290 | TT 75 | Hattat 290 | Tafe 8502 | JD 5075E |
| Engine make | Perkins | Iveco | Perkins | Simpson | JD PT |
| Number of cylinder | 4 | 4 | 4 | 4 | 3 |
| Cylinder capacity, cm3 | 4064 | 3908 | 4400 | 4000 | 2933 |
| Engine power, hp | 82 | 73.4 | 82 | 82 | 75 |
| Engine rpm | 2200 | 2500 | 2200 | 2200 | 2100 |
| Fuel tank capacity, l | 90 | 63 | 90 | 70 | 72.5 |
| PTO rpm | 540 | 540 | 540 | 540 | 540 |
| Engine rpm @ PTO rpm | 1789 | 1967 | 1685 | 1789 | 1800 |
| Hydraulic lift, kg | 2290 | 1900 | 2290 | 2145 | 2000 |
| Hydr. pump flow, l/min | 16.3 | 34 | 16.7 | 17.8 | 43.1 |
| Front tire size | 7.50 – 16 | 7.50 -16 | 7.50 -16 | 7.50 -16 | 7.50 -16 |
| Steering type | manual/hyd. | hydraulic | hydraulic | hydraulic | hydraulic |
| Country | UK | India | Turkey | India | India |
Tractor annual working hours was calculated by using the following procedures
IAHUi = IAAi ÷ IWRi
TAWH = Summation of IAWH i
Where:
IAHU = Implement annual hours of use (h/year)
IAA = Implement annual covered area (fed/year)
IWR = Implement work rate (fed/h)
TAWH = Tractor annual working hours
i = Implements accompanying tractor
Model development
The tractors’ initial purchase price, annual working hours and repair and maintenance expenses data were tabulated in separate excel worksheet for each tractor make. Power function mathematical model was selected to describe the correlation between the annual working hours (independent variable) and annual repair and maintenance costs as percentage of purchase price (dependent variable). It is hard to find full set of data for all of the surveyed tractors. However, the used data to develop the models were presented in Table 2. Thence, the model parameters (a and b), coefficient of determination (R2), F value and significant level were determined. The power function mathematical model was derived for each tractor make and the general mean by using the following equation (ASAE, 1989, Dahab et al., 2016).
Y = a X b
Where:
Y = annual repair and maintenance expenses as percentage of tractor initial purchase price
X = Tractor annual hour of use
a and b = model parameters
Implementation of the predicted general model
The general model developed in the present study was compared with some model developed in the Sudan and other models developed elsewhere to predict repair and maintenance costs. Moreover, the general model was used to predict tractor repair and maintenance cost per hour by using presumed values of tractor purchase prices and annual working hours. The values of repair and maintenance cost per hour wad calculated by using the following equation:
R&M (SDH/h) = (Y%/100%) * (IPP /TAWH)
Where:
R&M = Repair and maintenance costs (SDG/h)
Y% = Annual repair and maintenance expenses as percentage of tractor initial purchase price
IPP = Initial purchase price of tractor (SDG)
TAWH = Tractor annual working hours of use
Table 2. Basic information about the studied tractors in the Gezira scheme
| Tractor make/model | No of tractors | Range of age (yrs.) | Range of annual working hours |
| MF 290 | 6 | 2 to 15 | 452 – 947 |
| TT 75 | 5 | 2 to 17 | 300 – 999 |
| HATTAT 290 | 6 | 2 to 7 | 453 – 910 |
| TAFE 8502 | 8 | 3 to 12 | 308 – 1400 |
| John Deere 5075 E | 4 | 2 to 5 | 563 – 843 |
Development of prediction models
Table 3 shows the developed power models to predict repair and maintenance cost for different tractors make in the Gezira scheme. The results showed that the coefficient of determination (R2) of the developed models for the studied tractors make was very high ranging between 0.85 and 0.99. Moreover, the results revealed that the annual working hours had very high significant (P = 0.001) effect on repair and maintenance costs for all tractors and their general model and high significant (P = 0.01) effect for New Holland TT 75 as indicated by F value in Table 3. These results indicated that the annual working hours can effectively explain the variations in tractor repair and maintenance cost. Also, the results indicated that the developed models may have high confidence level in predicting repair and maintenance cost. Several authors elsewhere recommended the use of power model to predict repair and maintenance cost of tractor (ASAE, 1989; Bakht et al., 2009, Abubakar et al., 2013, Yousif, 2016, Dahab, et al., 2021).
The results revealed that there were variations in the developed models for the studied tractors make. For example, JD 5075E and MF 290 gave lower value of repair and maintenance costs compared to Tafe 8502, Hattat 290 and TT 75 (Fig.1). Moreover, the variations was obvious especially for Hattat 290 and JD 5075E tractors make where the repair and maintenance costs increased with the increase in annual hours of use, whereas for the other three tractors make the predicted repair and maintenance cost increased up to 1000 hour after that the increase was at decreasing rate (Fig.1). These variations may be due to the given care and maintenance management, skill of operators, availability of spare parts at optimum time in addition to tractor technical specifications (Dahab and Adam, 2002).
A general model for the studied tractors was developed to predict repair and maintenance cost for tractors working in the Gezira irrigated scheme (Table 3). This general model followed the same trend of the developed models of the studied tractors (power model). However, this general model predict higher values of repair and maintenance costs compared to MF 290 and JD 5075E and lower values in comparison with Tafe 8502 and Hattat 290 and approximately in close agreement with the values of TT 75 (Fig. 1).
Table 3. The developed power models to estimate R & M cost for tractors in the Gezira scheme
| Tractor make/model | Developed power models | R2 | F |
| Massey Ferguson 290 | Y = 0.0007 X0.7268 | 0.99 | 765.639 *** |
| New Holland TT 75 | Y = 0.0026 X0.5491 | 0.85 | 100.062 ** |
| HATTAT 290 | Y = 0.0009 X0.7207 | 0.98 | 877.875 *** |
| TAFE 8502 | Y = 0.0042 X0.4899 | 0.88 | 131.051 *** |
| John Deere 5075E | Y = 0.0001 X1.0136 | 0.88 | 1104.918 *** |
| General model | Y = 0.0011X0.6827 | 0.99 | 325.046 *** |
Y = Repair and maintenance cost as % of initial price, X = annual hours, ***, ** = significant at 0.001 and 0.01%, respectively.
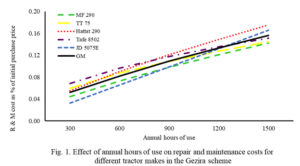
Table 4 shows the predicted values of repair and maintenance costs for the studied tractors. The results revealed that the JD 5075 E tractor obtained the lowest repair and maintenance cost values, followed by MF 290 tractor. However, the model for JD 5075 E predicted lower cost values up to 600 hours of use compared to MF 290, and then the MF 290 gave higher values. On the other hand, the highest cost values was obtained by Tafe 8502 tractor followed by Hattat 290 tractor. However, Hattat 290 tractor gave the highest prediction cost values up to 1500 hours of use. The variations in the repair and maintenance cost percentage between these tractor makes could be attributed to the differences in their technical specifications, operator’s skills and the received care and maintenance.
Table 4. Predicted R and M cost as percentage of initial purchase price for different tractor makes in the Gezira scheme
| Tractor make/model | Annual working hours | ||||
| 300 h | 600 h | 900 h | 1200 h | 1500 h | |
| Massey Ferguson 290 | 0.044 | 0.073 | 0.098 | 0.121 | 0.142 |
| New Holland TT 75 | 0.060 | 0.087 | 0.109 | 0.128 | 0.144 |
| Hattat 290 | 0.055 | 0.090 | 0.121 | 0.149 | 0.175 |
| Tafe 8502 | 0.069 | 0.096 | 0.118 | 0.135 | 0.151 |
| John Deere (JD 5075 E) | 0.032 | 0.065 | 0.099 | 0.132 | 0.166 |
Comparing the developed model with other similar models developed in the Sudan
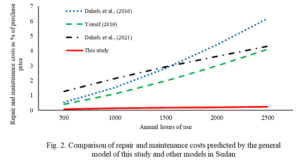
Figure 2 compares the predictions of the general model developed by this study with other three similar models (power models) recently developed in different agricultural areas in the Sudan for predicting tractor repair and maintenance costs. These models were developed by Dahab, et al., (2016) in New Halfa irrigated scheme, Yousif (2016) in Gedarif mechanized rainfed areas and Dahab, et al., (2021) in Dongola irrigated area Northern Sudan. This comparison revealed that each model exhibited differently from each other (Fig. 2). The results showed that the developed model from the present study gave the lowest values of repair and maintenance costs compared to the three models (Table 5). Abdalla (2012) found similar lower results when he compared his predictions with other predictions in the Sudan. This may be due to differences in tractors technical specifications, working conditions and services received. The variations may also be attributed to operator skills, the implements type used with tractor and cost computations methods. This result indicated that each specific agricultural area in the same country has to develop it is own special predicting models.
Table 5. Comparison between the developed models for predicting R and M costs in the Sudan and the present study
| The developed models | Source, location and sector | Predicted tractor R and M cost as % of purchase price | ||
| 500 h | 1000 h | 1500 h | ||
| Y = = 4E-05x1.527 | Dahab, et al., (2016) New Halfa/ irrigated | 0.53 | 1.52 | 2.83 |
| Y = 0.041 (X/100) 1.43 | Yousif (2016), Gedarif /rainfed | 0.41 | 1.10 | 1.97 |
| Y= 0.011x0.763 | Dahab, et al., (2021) Dongola/ irrigated | 1.26 | 2.14 | 2.92 |
| Y = 0.0011X0.6827 | The present study | 0.08 | 0.12 | 0.16 |
Comparing the developed model with other similar models developed in other countries
The established general power model from this study was also compared with three other similar models developed in countries other than Sudan for predicting tractor repair and maintenance cost (Table 6). These models were developed by ASAE (1989) in USA, Bakht et al., (2009) in Iran and Abubakar, et al., (2013) in Nigeria. The results indicated that of all the four models exhibited general agreement in that the predicted values of repair and maintenance costs increased with the increase in annual hours of use. However, each model exhibited different pattern of predictions from other model. Also, the results showed that the developed model from the present study gave the lowest values of repair and maintenance costs compared to the three models (Table 6). Abdalla (2012) found similar lower results when he compared his predictions with other predictions in other countries. The predictions by Abubakar, et al., (2013) in Nigeria were the highest among the other predictions models (Fig. 3). Figure 3 also shows the predictions of the present study was in close agreement with the predictions of ASAE (1989), especially at working hours less than 800 hours. These variations may be due to differences in tractors technical specifications, working conditions and services received. The variations may also be attributed to operator skills, the implements type used with tractor and cost computations methods. This result indicated that each specific agricultural area has to develop it is own special predicting models.
Table 6. Comparison between the developed models for predicting R and M costs in worldwide and the present study
| The developed models | Source and country | Predicted tractor R and M cost as % of purchase price | ||
| 500 h | 1000 h | 1500 h | ||
| Y = 0.002 X 1.162 | Bakht et al., (2009), Iran | 2.74 | 6.12 | 9.81 |
| Y = 1.2 (X/1000)2 | ASAE (1989), USA | 0.30 | 1.20 | 2.70 |
| Y = 0.005 X 1.2 | Abubakar et al., (2013), Nigeria | 8.66 | 19.91 | 32.38 |
| Y = 0.0011X0.6827 | The present study, Sudan | 0.08 | 0.12 | 0.16 |
Sensitivity analysis and Implementation of the developed general model
The general model developed in this study was used to predict tractor R&M cost (SDG/h). Table 7 shows the effect of changing price and annual working hours of a tractor on R&M cost per hour. The results showed that as tractor purchase price increased, the R&M cost (SDG/h) increased. The results indicated that, at the same annual hours of use, increasing the tractor purchase price by 100% increased the R&M cost (SDG/h) by 100%. On the other hand, as hours of use increased, R&M cost (SDG/h) increased too, but at decreasing rate. For example, at the same purchase price, increasing annual hours of use by 100% increased R&M cost (SDG/h) by about 60%. These results inferred that both purchase price and annual hours of use of tractor have affected R&M cost per hour, and the purchase price has the big effect compared to the annual hours of use. Abdalla (2012) concluded that repair and maintenance cost increased with the increase in tractor age and annual hours of use. The obtained values of repair and maintenance costs per hour were considered reasonable compared to customers price for mechanized operations and effective field capacities of machinery accompanying tractor in the Gezira scheme, especially for those values at 750 hours of use and less. For example, the average consumer price for ridging operation in the Gezira scheme was 8567 SDG/fed, which equal to 38551.5 SDG/h at average effective field capacity of ridger implement (4.5 fed/h). The percentage of the predicted repair and maintenance costs of a tractor at lower and higher purchase prices and at 750 hours of use (Table 7) from customers price was 15.7 % and 31.4%, respectively. These findings confirm the correctness and credibility of the developed models for predicting tractor repair and maintenance cost in the Gezira scheme at the period and situation of data collection.
Table 7. Effect tractor’s purchase price and annual hours of use on R and M cost (SDG/h) in the Gezira scheme
| Purchase price (SDG) | 250 h | 500 h | 750 h | 1000 h | 1250 h |
| 6000000 | 2862 | 4593 | 6058 | 7373 | 8586 |
| 8000000 | 3816 | 6124 | 8078 | 9831 | 11448 |
| 10000000 | 4769 | 7656 | 10097 | 12288 | 14310 |
| 12000000 | 5723 | 9187 | 12117 | 14746 | 17173 |

The author has not declare any conflict of interest