Social Class and Choice af Fast Moving Consumer Healthcare Products Among Women in Southeast Nigeria.
OGBU-NWALI, Ogonna E., ENEH, Nnajiofor C. PhD, NWEKE Maduabuchi C., ABUGU Nneka J., UGWUJA Chioma P., OTEI Chinwendu D., PhD, UFONDU, Adaora O. PhD, OBEKE Chinyere B.
This research work investigated social class and the choice of fast-moving consumer healthcare products (FMCHP) to find the relationship between income and occupation and the choice of healthcare products among women in Southeast Nigeria. The study adopted the descriptive correlational research design, specifically the survey method. The population size of the study was 1,671,795, which is the population of women in Southeast, according to the National Population Commission. A sample of 246 was drawn using Cochran’s formula for sample size determination. The research instrument reliability test was conducted using Cronbach’s alpha, and a coefficient of .856 was achieved. While Descriptive Statistics Simple Percentage was used to analyse the data on the respondent’s profile in section A, Inferential Statistics Simple Regression Analysis was used to test the hypotheses. The study shows that women’s choice of healthcare products is influenced by their income and occupation. This indicates that a woman’s social class impacts her choice of healthcare products. Hence, the study recommends that manufacturers of FMCHPs should look more at factors like the price of the products and the brand ambassador or model they use to advertise their products as more important factors that influence women’s buying decisions. Secondly, consumers should try to choose products that are of higher quality regardless of their income, occupation, or educational qualifications.
KeyWords: Social Class, Consumer, products, Income, Occupation, choice.
Consumer behaviour could hardly be understood without considering social class. The immediate foundations of behaviour are instigating stimuli, temporal motivation, external motivation, and lastly, a learned habit, which comprises attitudes, beliefs and values (Rossiter & Foxall, 2008; Bauer, Job, & Hannover, 2023). Social class is connected to the last of these causes, learned habit (Rossiter 2012). The social strata one belongs to poses a powerful influence on almost everything in their daily lives—dressing, looks, travels, residence, what we drive, what media we consume, dine and shop, etc.
The concept of social class was introduced into the marketing literature in the late 1950s (Ahmed, Samad, & Khan, 2016). Since then, marketing scholars and practitioners have paid considerable attention to it. The concept of social class is not novel, but its use in consumer behaviour has gained acceptance over time. However, there are still some inconsistencies and misperceptions about using the concept.”
“Social class may be well defined as consistent and moderately stable divisions in a society in which persons and families sharing related values, interests, and behaviour can be classified” (Ho & Lau, 2023). Social class refers to placing members of society in order of diverse positions and according to their ranks.” (Ahmed, Samad, & Khan, 2016).
Furthermore, social class is traditionally classified into six types by Warner (1949), and they consist of namely, Upper-upper class, Lower-upper class, Upper-middle class, Lower-middle class, Upper-lower class, and Lower-lower class. This hierarchy or the traditional pyramid of classification of various social courses forms a waterfall of decreasing needs. Its wishes start from the upper-upper class and the elite group and flow to the lower-lower class, the underprivileged and under-employed group (Subrahmanyan & Gomez-Arias, 2008).
The classification of social classes is usually measured based on occupation (Oakes & Rossi, 2003; Anna, Melany, Dian, & Deviga, 2019; Roxanne, Vernon, & Paul, 2016) or income (Engzell & Mood, 2021; Portes & Rumbaut, 2001; Ahmed, Samad, & Khan, 2016). These variables are usually considered the driving forces when a marketing strategy developer studies the consumer behaviour of a group of people (Shavitt, Duo, & Hyewon, 2016).
The fast-moving consumer goods (FMCG) sector, also called the consumer packaged goods (CPG) sector, is one of the largest industries worldwide. Products with quick turnover and relatively low cost are known as FMCGs (Kim & Sommet, 2023). FMCGs are cheap products with a short shelf life that consumers purchase regularly. Some of the most well-known FMCG companies in the world include Unilever, The Coca-Cola Company, Johnson & Johnson products, Nescafe, Budweiser, etc. FMCGs involve non-durable household goods such as packaged foods, beverages, toiletries, candies, cosmetics, over-the-counter drugs, dry goods and other consumables. All of us use FMCG every day.
Furthermore, the global FMCG market based on food and healthcare product type is classified as food and beverages, personal care, skincare, cosmetics, hair care, etc., healthcare (over-the-counter drugs, vitamins and dietary supplements, oral care, feminine care and others) and home care products. The healthcare industry includes many sectors that provide goods and services to treat patients with curative, preventive, rehabilitative and palliative care. Socio-economic factors are one of the most significant factors that determine a consumer’s level of access to healthcare. Much attention has been given to the concepts of consumers’ socio-economic status (SES), position and social class by researchers in the health sector (Mahato, 2023). Social class significantly influences a person’s physical health, ability to receive adequate medical health and nutrition, and life expectancy.
However, any business operating with healthcare products under FMCG needs to put consumer decision-making at the forefront to understand consumers’ actions better (Berry, Cultivating service brand equity, 2010). Since social classes are homogeneous divisions of society, each segment of social class exhibits similar lifestyles, values, statuses, prestige and interests; that way, the behavioural patterns of the members become identical. So, the behavioural pattern differs among social classes. The knowledge of social class helps firms and organisations improve their marketing strategies by understanding the psychology of consumers, how they think, feel, reason, and select between different alternatives, the psychology of how the consumer is influenced by their environment (e.g., culture, family, signs, media). Marketers must craft creative marketing strategies for which marketers must explore the perceptions of customers who are looking for parameters in selecting any brand of healthcare products (Bauer, Job, & Hannover, 2023). This study examined the influence of social class on the choice of FMCGs in the healthcare sector, particularly on pharmaceuticals.
Statement of the Problem
Understanding women’s consumption behaviour about their social class has prompted challenges to marketers who have tried to study women over time. In Southeast Nigeria, it has been a worry to manufacturers of healthcare products of FMCGs as they try to know the best products to provide to maximise profit in their businesses.
Due to this problem, the dealers of these healthcare products run into a conundrum as they get to dump all their products in the markets, expecting the women to purchase and consume these products. Thus, dealers of these products go on a trial and error style, looking up to the consumers to buy the products before they can choose the products that are the real healthcare products. This conundrum in the consumer behaviour of healthcare products by women has affected the manufacturers, distributors and consumers. It has not been easy to know the healthcare products that are termed FMCGs for women in Southeast.
Most businesses have tried to study the Southeast Market to understand what excites or dictates women’s consumption behaviour but have not achieved this fit as some businesses are no longer in existence, others have also relocated their business outfit due to the confusion in the market caused by the social class.
The inability of the manufacturers and distributors of consumer goods to understand and dictate the decision-making choices by the women in Southeast have led to a decline in the consumer goods business. This also affects the economy of the region as many retail outlets and mega supermarkets deal on these consumer goods. The consequences of these problems affect the region as most big supermarkets find it challenging to put up the best consumer products (FMCGs). This problem goes beyond the consumption pattern of women but also affects the producers of consumer goods.
Literature demonstrates that social class influences consumers’ choice generally and that the position of a customer in society as indicated by social class variables, that is, whether they belong to the lower class, middle class or upper class, to a considerable extent determines the price, the product type and whatever kind of product they may want to purchase (Theophile, 2020; Zohra, 2020). While this may be true of products that belong to the food and beverages categories and other kinds of personal care items, literature is not very clear about the truism of this assertion to health-related products. For instance, when a person falls sick, what he needs at that particular time is expert medical care and health. So when he visits a medical doctor, for instance, and consults them for their advice, it is expected that the medical personnel prescribes drugs they are to take to handle whatever ailment they may be having at that point and an individual who is on the verge of dying or sick no matter how highly placed they are or no matter the level he is on the social class cadre will hardly want to consider what brand of drugs administered to him in other to get rid of the illness. All he wants at that time is care, so whether social class affected his decision to purchase a product because it is manufactured by a lower-profiled pharmaceutical company or a higher-profiled pharmaceutical company is not clear in literature, and so this study, therefore, pursues to find out the level to which social class impacts womens’ choice of FMCGs in the health care products.
This study will measure social class with the following variables: occupation and income. It is imperative to understand that in connecting a product to the social class of a person or a group, the product or brand consumed varies according to income, which may restrict the purchase of expensive items like cars, choice of drugs, and lifestyle,
Research Objectives
The main objective of this study is to determine how social class influence the purchasing pattern of healthcare products among women in Southeast Nigeria. The following are the specific objectives that can be drawn from the above:
Research Questions
Research Hypotheses
The following NULL hypotheses guided the study:
Significance of the Study
Consumers’ consumption-related behaviour helps them gain valuable insights, making them sensible consumers. Marketers benefit from understanding how consumers make consumption decisions, which is highly advantageous to marketers because it aids in formulating suitable marketing strategies. They can envisage the consumers’ reactions to various clues, especially concerning generating information and organisational growth. This gives them a competitive edge over others.
Social group memberships primarily differentiate consumption habits in some products and service markets. The study of the influence of social class in purchasing and consuming fast-moving consumer goods and healthcare products should, therefore, be of eminent concern to marketing managers. Social classes are the largest homogenous grouping within a society. Every member in a group tends to behave alike and differs from other groups. These bring about interpersonal communications about products, stores, and so forth, which they prefer; it then suits the ability of marketing managers to identify the different needs of each group and develop and distribute products that will fit each homogenous social grouping. Against these backgrounds, a study of the influence of social class on the purchase and consumption of healthcare products among women in Southeast Nigeria comes through.
The Concept of Consumer Behaviour
Consumer behaviour can be defined as the behaviour consumers exhibit in searching, purchasing, evaluating and disposing of products and services that they anticipate will satisfy their needs (Oghojafor & Nwagwu, 2013). According to Kotler and Armstrong (2008), consumer buyer behaviour refers to final consumer individuals and households buying goods and services for personal consumption. Contemporary marketing zeroed marketing is consumer-focused, and it is connected to the needs and aspirations of consumers. Studying these consumers and their purchasing patterns is vital for companies to formulate how these needs can be used (Agarwal, 2013).
Contemporary marketing considers customers as kings; that way, the consumer’s choice of products, quality and quantity, determines what should be manufactured. Marketers should consider some aspects before deciding on the particular products to market. Hence, the job of marketers and manufacturers tends to get challenging, making marketers focus more on the need to know the consumers better.
The aims of studying consumer behaviour are to form proper descriptions, explanation and ultimate reaction to consumers’ activities in the market. So many difficulties are involved in understanding consumers’ behaviour, which makes it somewhat tasking. The problem in understanding the consumers’ needs is repeatedly a high and inaccurate procedure. This procedure is highly imperative in shaping purchasing behaviour of consumers. To be able to offer an actual service, it is pertinent to identify different segments of consumers, putting into consideration the satisfaction aspired by the consumer (Schiffman & Das, 2006; Zohra, 2020). For this purpose, the pursuit of consumer information has been the attention of so many articles for well over 30 years.
Consumer behaviour is the study of the procedure interconnected to how and when a person or group of persons select, purchase, use or dispose of products, services, ideas or experiences to satisfy needs and desires (Solomon & Nancy, 2014; Solomon, 2014).
Consumer behaviour is the study of consumer reaction to services, products and how these products and services are marketed (Frank, 2012). The conception of recent marketing is that consumers regularly buy products for what they stand for, not what they do. This concept insinuates that these products perform some duties even more than their primary functions; this makes consumers lean to initiate a connection with the goods that appeal to them. A consumer tends to create a series of links with a product, which could appear in the form of sentimental attachment, self-concept attachment, and love and interdependence (Solomon & Nancy, 2014).
The following variables were conceptualised to help understand consumer decision-making behaviour; novelty and fashion, perfectionism, brand consciousness, confused by over-choice consumer, impulsive and careless consumer, habitual and brand loyal consumer, price and value conciseness, recreational and hedonic shopping conciseness (Sproles & Kendal , 2006).
Importance of Consumer Behaviour
Consumers gain valued vision in their related behaviour. It keeps them informed as consumers. Marketers benefit by gaining insight into what drives consumers to decide what they consume, which helps them frame befitting marketing strategies. Marketers envisage the behaviour of the consumers to various ideas like organisational and informational (Allen, 2002). This gives them a competitive advantage. Formally, marketers used to think that if they could predict consumer behaviour, they would greatly influence it, which is a positivist approach to consumer behaviour. Consumer behaviour was considered as just applied marketing management. Drawing from various disciplines, consumer behaviour expands into an interdisciplinary subject. This has become a topic of study going beyond scanty marketing and managerial perspective, there is excellent attention on simply comprehending all hints of consumer behaviour, and this avenue is called interactive. There are a lot of factors that affect buying experience, which plays a significant role in consumer behaviour (Basha, 2016). Therefore, interpretive is also called experetivism. These two harmonise, yet adequate attention is given to understanding consumption-related decisions. This harmonisation pays off in enriching the focus on consumer behaviour and developing better tactics.
Social Class
There are existing disparities within the sociological proses, which is usually assessed through stratification and has paid considerable attention over time on class, castes, gender, status and may be age. Gender, age and caste are not admissible to the topic under discussion; our core subject here is social class (Lawson & Todd, 2002).
Social class is a comparatively homogenous and enduring social division, grouped hierarchically and with members sharing related interests, behaviour and values (Solomon, Bamossy & Askegaard, 2009). Social class is the partitioning of members of a group or society into a pyramid of separate status classes, with memberships of each segment having lower or higher status than members of some other classes (Kotler & Armstrong, 2010; Schiffman & Das, 2006). Therefore, it is seen that social class is considered to have several characteristics such as education levels, similarity in behaviour of members in structure, attitudes and communication manner, values, income, the propensity of moving from one social class to another and place of residence (Allen, 2002; Williams, 2002; Gherasim, 2013). Summarily, a person’s measurable possessions mainly mold social class and how they are conceptually ranked in society (Kraus & Mendoza, 2012).
Income is not the only indicator of social class. Social classes could equally be revealed in other dispositions such as education, area of residence and occupation. The social class a person, belongs to always shows in their speed pattern, dress sense, leisure choices, and so many other appearances.
Social classes display detailed brand preferences, products and different scopes, including furniture, clothing, cars and leisure activities (Ozo, 2002; Alooma & Lawan, 2013). Social class, which is correctly said to be a person’s place in society and social standing, has remained an essential indicator of the main reason behind consumer behaviours (O’Cass & McEwen, 2004; Rashmi, 2013). Researchers in marketing and their cohorts in social psychology have regularly brought out some socio-demographic constructs as objectives. They are usually shown by a particular or even double household’s heads:
A sole element do not determine social class, but it is measured as a combination of various factors, such as occupation, income, wealth, education, authority, property, power, ownership, consumption pattern, life styles etc. Consumers’ decision pertaining to their product purchase is of vital concern, especially when it connects to the social class segment a person belongs to.
Consumers’ perceptions about purchase decisions and product quality are usually influenced by the degree to which they participate, which is aroused by the product category being considered.
Ahmed et al. (2004) opine that the extent of purchase exposures prompt different levels of purchase involvement, which is presented based on the various product groupings. O’ Cass (2004) states that monetary outlay and social implications influence the degree to which consumers are involved in purchasing and using products. Hence, brand names are expected to influence purchase decisions, usually determined by the social implication resulting from product usage. Each grouping of social class shares mutual principles and ways of thinking, speaking and behaving (Fernandez, et al., 2024). Thus, Consumers relate more with people of their social class since each class has the same values and patterns of behaviour. Therefore, marketers must retort mainly to groups (Gherasim, 2013).
In the late 1950s and early 1960s, several contributions were raised to the marketing literature, which states the significance of social class in consumer behaviour (Ahmed, Samad, & Khan, 2016). These early contributions were mostly to Warner’s conception of social class, which allied with the prestige and position of families within moderately small, self-contained communities (Bruno, Toczek-Capelle, & Darnon, 2020) that exhibit distinct social class and display a particular shopping pattern.
Social Classes characteristics (Gherasim, 2013);
Moving from one social strata to another in some traditional societies could be difficult, but anybody can become a prime minister (Solomon, Bamossy, & Askegaard, Consumer behaviour: An European perspective, 2009). Some people cross some social obstacles but at a very young age. Younger people could embrace some lifestyles different from that of their parents. Their level could avail this opportunity of income and education. Thus, social mobility gives people flexible movement in the social class pyramid. Social mobility is defined as the transition of individuals from one social class to another, and it can appear in either of these three; upward, downward or even horizontal form (Solomon, Bamossy, & Askegaard, Consumer behaviour: An European perspective, 2009);
Social Class Categories
Social class has several categories. The categories include living area, income, education, family background, wealth etc. (Allen, 2002). Income, Education and Occupation are the three major classifications of social class (Kraus & Mendoza, 2012).
Local settings can help shape an individual’s view of the reference group with whom they try to measure their material wealth (Long & Dunn, 2023). When people are connected to relatively the same wealth category, they may begin to see themselves as people associated with different social classes. Still, it all depends on who they are trying to measure up with. Mihic and Gordana (2006) claim that the behaviour pattern among individuals from different social classes could still be similar, indicating that social class has something to do with consumers’ lifestyles and values. Attitudes and personal values have a high impact on buyers’ behaviour, much more than the income they could have access to. The implication indicates that people of separate social classes can spend on different contents and activities depending on their values and preferences.
There are varying social class categories depending on the country and its geographical characteristics. According to Kotler and Keller (2010), social class is classified into seven types: working class, upper-lower, lower lowers, middle class, upper-middle, and upper and lower uppers. The Philips Consulting Survey Report (2014) shows that the middle-class class earns between 75,000 and 100,000 monthly in Nigeria. Therefore, the lower social class category would be those that earn less than 75,000 monthly, and the upper social class category earns above 100,000 monthly.
Some variables, about nine in number, have been set up as most necessary in streaming sociology and research connected to social class. The variables were recognised in a powerful blend of research done by Gilber and Kahl, which was assembled in the following style (Engzell & Mood, 2021);
The features of these groupings are not far different from one another; Warner’s social class division is highlighted as follows;
W. L. Warner and his coworkers constructed the following six classifications of American society.
| Upper | – | Upper | – | Aristocracy “social register.” |
| Lower | – | Upper | – | New rich “Nouveau riche” |
| Upper | – | Middle | – | Professionals and managers |
| Lower | – | Middle | – | White-collar workers |
| Upper | – | Lower | – | Blue-collar workers |
| Lower | – | Lower | – | Unskilled labourers |
Upper Upper Class
This group is the wealthiest, noble class possessing a lot of property. They are usually found in a small-sized segment and have to be targeted for novelty, expensive and luxury goods by marketers. This class is highly connected to property, prestige and power. They can buy their desired products and service because of the discretionary income available to them and services and socialise with the right people. They are highly attracted to goods for leisure, vacations, exceptional benefits and designer clothes.
Lower Upper Class
This segment is of lower status than the upper-upper, and they try to imitate the lifestyle of the upper-upper class. They live their lives by consuming conspicuous goods. This smaller segment is targeted at luxury goods. They try to replicate the habits and lifestyles of the upper-upper class. The product consumed by this particular segment is termed the trickledown effect because they trickle down to this class. They look up to the upper class as reference groups and struggle to meet a higher status in the society. Marketers, therefore, work towards formulating strategies for this group or category of people.
Upper Middle Class
This class has attained some level of success in life and comprises professionals, managers, professors and lawyers. They own medium-sized businesses. They belong to some clubs and try to expand their traditional interests. They are the segments that work hard and strive to reach a higher level in society. The upper class is their aspirational group.
Lower Middle Class
The commoner represents this group. Some of the people in this segment earn high and are small business owners who have attained low education. This segment is aspiring for honor in society. People in this class aspire to be residents in good neighborhoods. Products sold by marketers to this segment have social acceptance and are virtuous in the community.
Upper Lower Class
This group, with the lower-lower class, makes up a significant percentage of the population. They live their lives for the present. This group and the lower-lower type comprise most of the people. Culture and subculture influence their buying behaviour. Hence, their product choice is influenced by social activities.
Lower-Lower Class
This group exists in utmost poverty. They are only interested in fulfilling their basic biological needs. The group members need clothing, food and shelter, so they buy cheap products. They first consider price before purchases since they do not have the money for unnecessary expenses.
Social Classes and their Buying Patterns
Every member of the social class segment has relatively the same status. The buying pattern of individuals and groups are highly influenced by the social class to which they belong or aspire to belong. Social class is also connected to demographic and geographic data. These classes live in clusters and have relatively homogeneous geodemographic segments in things like housing, urbanisation and others (Bruno, Toczek-Capelle, & Darnon, 2020). The class difference in status plays out in their kind of food, housing, clothing, purchases and lifestyle. People look up to their peers, which makes them buy the same kind of product, and meet the expectations of their social class grouping. For example, a person from the middle class would normally go for economically priced vehicles, which helps marketers target products based on each market segment.
Occupation
Occupation is an integral part of everyone’s life. It is an essentials social class indicator. It informs people about the education someone has attained and also about their economic position. According to Wilcock, occupation is defined as everything people do, the relationship of what they do with who they are as human beings (Da Silva, Honorato, Sobrinho, & Dos Santos, 2023). A consumer’s occupation and purchasing power influence his purchase decisions and buying behavior. People, who share similar occupations, tend to have similar taste in music, clothing and leisure activities. They usually socialise with each other, and share the same kind of values and ideas. In measuring social class, a consumer analyst uses occupation, which is perceived as the best available single indicator. The reason is that some occupations are seen as worthy rather than their jobs. It has been observed that individuals can rank abstract occupational titles in terms of prestige, even if they do not know who fills them.
The prestigious rating of occupations is the basis for determining a person’s rank in the social class system. Occupational rating is exceptionally similar beyond all modern industrial societies, with professionals being the highest and unskilled workers the lowest. The universal status hierarchy gives itself to a functional explanation by Guata & Gangal (2011), implying that complex societies have a verse division of labour. It is seen that occupational roles requiring different levels of skills and control over information where skills and knowledge are difficult to obtain can be restricted to a small group. Occupation as a variable of social class reflects dedication, social standing, income and psychological aspirations.
Income
Income is a significant measure of social class. It is the money earned consistently for work or investments. It comprises the summation of all salaries, profits, wages, return on investment, rents, etc. A family’s income level determines the purchasing power, joined with wealth accrued over time. The income level affects what consumers can afford and the perspective towards money.. Income level affects what a consumer can afford as well as his spending habit (Solomon M. , 2014) There is a massive gap in the demand for products for the rich, high-income, middle-income, low-income and poor, making income with criteria for social classification. Income plays a vital role because an individual’s income helps in their daily expenses; the higher the income, the higher the spending and vice versa. A person’s earning determines if the person goes for luxuries or decide to save. With improvement in earnings, consumers with high income tend to acquire more luxury goods because their need and consumption for luxury increases, which also plays out for lower and middle-income earners. Income definitely influences the choice of goods because a consumer’s income determines what people can afford to buy
Fast Moving Consumer Good
Businesses operating under obviously operating FMCGs should always consider consumer purchase decisions (Berry, 2010). Consumer packaged goods are generally accepted when referring to FMCGs. FMCGs consist of all consumables (besides pulses/groceries) bought at steady interim. They are goods with a high turnover rate and are purchased relatively cheaply. Usually, the FMCG industry is involved with procedures like production, distribution and marketing. The FMCG industry also deals with supply chain, operations and general management. The most commonly used FMCGs include packaged goods such as detergents, toilet soaps, shaving sticks, shampoos, toothpaste, household accessories and shoe polish. It also spreads to a good number of electronic products. The items mentioned above are bought and consumed on a daily bases. Consumers do not add energy to buying FMCGs as they do for other products. The accumulative gain from selling FMCGs can be relatively large simply because they deal in large quantities (Agarwal, 2013).
However, FMCGs consist of non-food and food people consume daily. Decisions taken to purchase consumer goods are usually insignificant (Dora, Eta, & Iva, 2023). Manufacturers use massive advertising and other promotional activities to market their FMCGs, which helps form a significant part of total consumer purchases.
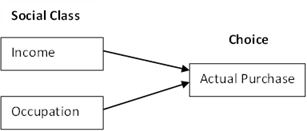
Figure 1: Researcher’s Conceptual Framework
Healthcare Industry
The healthcare industry is a substantial sector in the FMCG world, comprising several sectors providing goods and services for treating patients. They provide services such as treating people, preventing illness and providing medicines and palliative care. The healthcare industry, directly and indirectly, plays a significant role in the lives and well-being of people worldwide.
Gender and race are critical factors in explaining healthcare inequality, but socio-economic status is the most significant determinant in every consumer’s accessibility to healthcare. The socio-economic class has a direct link to health (Amemiya, Mortenson, Ahn, Walker, & Heyman, 2022)
Consumers of the lower economic class are usually unable to use healthcare as often as necessary. When they do, it is generally of lower quality, even when they are more prone to higher health challenges. Individuals in the lower class apparently have attained less education as well as income level and are primarily working without significant healthcare benefits vis a viz; consumers of higher standing who most times are qualified to work in places that provide healthcare insurance.
Theoretical Framework
The Consumer Decision Model by Engel Kollat and Blackwell (1968) was used to underpin the study of social class and choice of FMCGs.
Consumer Decision Model
The Consumer Decision Model is also known as the Engel-Blackwell-Miniard Model (Blackwell, Miniard et al. 2001). The model was established in 1968 and passed through frequent reviews; the model shown in Fig 1.5 below is the newest publication. The model is planned with a seven-point decision process, which includes; need recognition seconded by internal and external information search, then evaluation of alternatives, purchase, post-purchase consideration and lastly, divestment.
Each process mentioned above entails taking decisions influenced by two significant factors. Firstly, the consumer receives a signal processed in concurrence with memories from former experiences, followed by external factors that appear as individual differences or Environmental stimuli, including social class, personal power, culture, family and situation. The individual elements include motivation and involvement, consumer resources, attitudes, knowledge, values, personality and lifestyle.
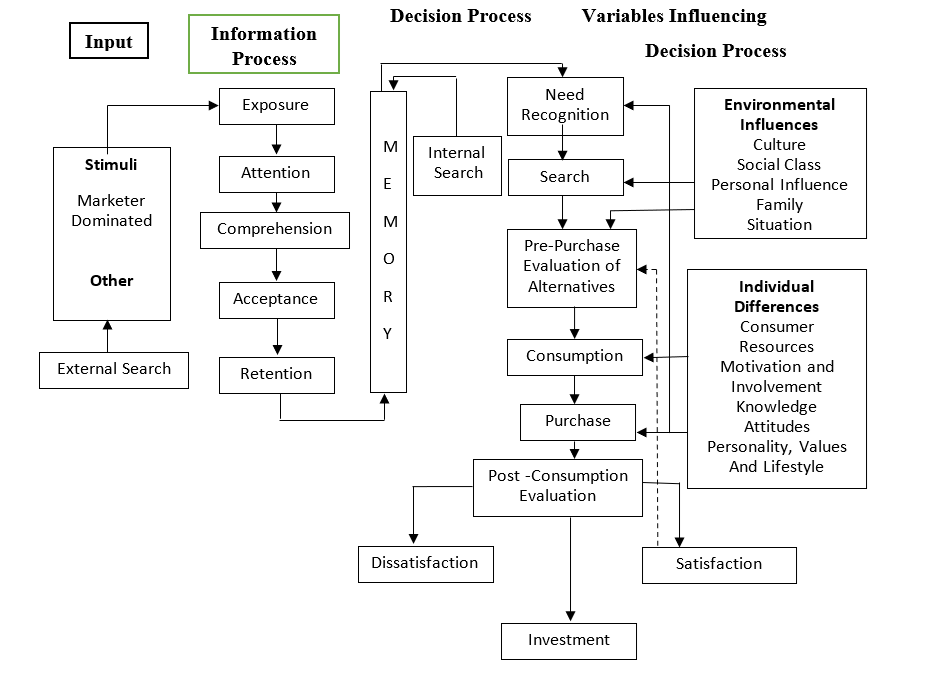
Figure 2: Consumer Decision Model
Source: (Blackwell, Miniard et al. 2001)
Accessing the model is first through need recognition; the consumer identifies a gap due to their desires and then considers some appropriate available choices. The move is motivated by communication between environmental and individual variables and the processed input stimuli. Immediately the desire to satisfy a need has been acknowledged; the consumer gets on with searching for information, which entails internal considerations based on the previous experience and external environmental influences. The extent to which information is sourced will depend on the nature of the problem-solving.
There are five stages or processes information passes through before storage and use: exposure, attention, comprehension, acceptance and retention. Consumer choices are accessed by establishing attitudes, beliefs and purchase intentions. This evaluation process is influenced by
Environmental variables such as personal influence, culture, social class, situation, family, and individual variables, including motivation and involvement, consumer resources, knowledge, personality, attitudes, values and lifestyles.
It is shown that intention as the direct for bearer to purchase is tolerated by the model as the only outcome. Some inhibitors are not clearly shown to intervene between purchase and purpose; however, individual and environmental factors tend to act on investment. The situation as a listed ecological influence is not noticeably defined. Still, it could include factors such as a financial situation or time pressure which may play an inhibitor role in the consumers’ realisation of their purchase intentions.
After the consumption follows the post-consumption evaluation, this is a feedback function for forthcoming external searches and belief creation. Divestment is illustrated as the last stage in recognising that the purchased product may probably be sold post-consumption.
Social class as an environmental influence plays a significant role in choice making and the actual purchase and consumption habits which involves with health care products. The social class appears to influence the thinking styles people adopt (Carey and Markus, 2016), which may have implications for how they process information in general.
The significance of social class on consumer behaviour cannot be over-emphasised, and this impact may start at a very young age. Some researchers claim that children tend to start learning purchase behaviours or young people begin learning behaviours and gaining some lifestyle habits from their families depending on their social status. Amemiya, Mortenson, Ahn, Walker, & Heyman (2022) believe that children grab some styles of purchasing processes at a relatively early stage in the more affluent families. At the point of making a choice which is the actual purchase, the consumers are equally influenced by individual factors such as consumer resources (income), motivation and involvement, knowledge (educational attainment), attitude, personality and lifestyle, which aid his purchase and consumption.
Survey research method was employed to assess Social Class and Choice of Fast Moving Consumer Goods Among Women in Southeast Nigeria with the target population being women in southeast Nigeria totaling 1,671,795 according to the National Population Commission(2018). A sample of 246 was drawn using the Cochrans formular and purposive sampling technique was adopted so as to select the most relevant respondents. Structured questionnaire was used for data collection. Data collected were presented using tables, percentages and frequency distribution. Simple regression analysis was used to test the formulated hypothesis.
Presentation And Data Analysis
Table 1: Demographic Characteristics of Respondents
| Frequency | Percent | Valid Percent | Cumulative Percent | ||
| Age: 10 – 23 years
24 – 37 years 38 – 51 years 52 and above Total |
20
74 85 38 217 |
9
34 39 18 100.0 |
9
34 39 18 100.0 |
9
43 82 100.0
|
|
| Monthly N1,000:00 – N50,000:00
Income: N51,000:00 – N100,000:00 N101,000:00 – N150,000:00 N151,000:00 and Above Total |
33
82 65 37 217 |
15
38 30 17 100.0 |
15
38 30 17 100.0 |
15
53 83 100.0
|
|
| Employment
Status:
|
Full Employment | 40 | 18 | 18 | 18 |
| Part-time | 65 | 30 | 30 | 48 | |
| Unemployed | 35 | 16 | 16 | 64 | |
| Self employed
Total |
77
217 |
36
100.0 |
36
100.0 |
100 | |
| Marital Status
|
Single
Married Divorced Widow/widower Total |
85
105 10 17 217 |
39
48 5 8 100.0 |
39
48 5 8 100.0 |
39
87 92 100.0
|
Source; Field Survey, 2023
Demographic Analysis of Respondents
The table above shows age bracket, 20(9%) are within below 23 years age bracket; 74(34%) fall within 23-38 years age bracket; 85(39%) fall within 38-50 years age bracket; while the remaining 38(18%) are above 50 years of age. The next information is on the monthly income of the respondents. The analysis shows that 33(15%) earn below 50,000 thousand naira per month, 82(38%) earn between 50,000 and 100,000 thousand naira per month; while 65(30%) receive between 100,000 to 150,000 thousand naira monthly. But 37(17%) earn above 150,000 thousand naira monthly. On employment status, 40(18%) of the respondents are full employed; 65(30%) are in part time job; 35(16%) respondents are unemployed; while 77(36%) respondents are self-employed. On marital status, analysis shows that 85(39%) of the respondents are single, while 105(48%) are married. Furthermore, 10(5%) respondents are divorced and 17(8%) are widow/widower. The above results imply that most respondents are knowledgeable, experienced and reasonable in answering the research questions.
Table 2: Income as a Measure of Choice
| Income Items | Strongly
Agree |
Agree | Undecided | Disagree | Strongly
Disagree |
|||||
| Freq. | % | Freq. | % | Freq. | % | Freq. | % | Freq. | % | |
| I buy drugs based on how much
I earn |
85 | 39.2 | 70 | 32.3 | 15 | 6.9 | 33 | 15.2 | 14 | 6.5 |
| My income determines the quality of drugs I could buy | 70 | 32.3 | 82 | 37.8 | 27 | 12.4 | 17 | 7.8 | 21 | 9.7 |
| I buy cheaper drugs when my income is low | 66 | 30.4 | 93 | 42.9 | 20 | 9.2 | 18 | 8.3 | 20 | 9.2 |
Source; Field Survey, 2023
The table 3, item 1, the drugs I buy is based on how much I earn, 14(6.5%) strongly disagree, 33(15.2%) disagree, 15(6.9%) were undecided, 70(32.3%) agree, while 85(39.2%) strongly agree. On item 2, my income determines the quality of drugs I buy 70(32.3%) strongly agree, 82(37.8%) agree on the statement, 27(12.4%) were undecided, 17(7.8%) disagree, while 21(9.7%) strongly disagree. Again, item 3, I consider cheaper drugs when my income is low 66 (30.4%) and 93(42.9%) respondents strongly agreed and agreed on the statement, respectively. while 20(9.2%) respondents were indecisive, however, 18(8.3%) and 20(9.2%) disagreed with the assertion.
Table 3: Occupation as a Measure of Choice
| Occupation Items | Strongly Agree | Agree | Undecided | Disagree | Strongly Disagree | |||||
| Freq. | % | Freq. | % | Freq. | % | Freq. | % | Freq. | % | |
| My job determines the kind of drugs I can afford | 71 | 32.7 | 87 | 41.1 | 20 | 9.2 | 31 | 14.3 | 8 | 3.7 |
| My job position determines the drugs I buy | 76 | 35.0 | 80 | 36.9 | 25 | 11.5 | 20 | 9.2 | 16 | 7.4 |
| My job makes me want to buy certain brands of drugs | 78 | 35.9 | 67 | 28.1 | 22 | 10.1 | 31 | 14.3 | 25 | 11.5 |
| If I get a better job, I will change the brands of drugs I purchase | 74 | 34.1 | 66 | 30.4 | 27 | 12.4 | 23 | 10.6 | 27 | 12.4 |
Source; Field Survey, 2023
The table 4 shows that 71 (32.7%) and 87 (41.1%) respondents strongly agreed and agreed with item 1. The job I do helps shape the drugs I buy, and 20(9.2%) were neutral, while 31(14.3%) and 8 (3.7%) disagreed with the statement. However, 76(35.0%) and 80(36.9%) respondents supported the statement on item 2. My job position determines the drugs I buy; 25 (11.5%) were indifferent, while 20(9.2%) and 16(7.4%) respondents disagreed with the statement. On item 3, My job makes me want to buy certain brands of drug, 78 (35.9%) and 67(28.1%) agreed, 31 (14.3%) and 25(11.5%) disagreed with the statement, and 22(10.1%) were indifferent. On item 4, If I get a better job, I will change the brands of drugs I purchase, 27(12.4%) strongly disagree, 23(10.6%) disagree, 27(12.4%) were undecided, 66(30.4%) agree, while 74(34.1%) respondents strongly agree.
Table 4: Customer Choice
| Customer Choice Items | Strongly Agree | Agree | Undecided | Disagree | Strongly Disagree | |||||
| Freq. | % | Freq. | % | Freq. | % | Freq. | % | Freq. | % | |
| Overall, I will choose medications based on my income level | 71 | 32.7 | 66 | 30.4 | 20 | 9.2 | 23 | 10.6 | 37 | 17.1 |
| The purchases I make must reflect my educational level | 77 | 35.5 | 58 | 26.7 | 35 | 16.1 | 21 | 9.7 | 26 | 12.0 |
| I buy drugs befitting of my occupation | 67 | 30.9 | 72 | 33.2 | 18 | 8.3 | 25 | 11.5 | 35 | 16.1 |
Source; Field Survey, 2023
The table 5, Overall, I will choose medications based on my income level, 37(17.1%) strongly disagree; 23(10.6%) disagree; 20(9.2%) are undecided; 66(30.4%) agree while 71(32.7%) strongly agree. On item 2, The purchases I make must reflect my educational level, 26(12.0%) strongly disagree, 21(9.7%) disagree, 35(16.1%) were undecided, 58(26.7%) agree, while 77(35.5%) strongly agree. Again, item 3, I buy drugs, befitting of my occupation, 67(30.9%) and 72(33.2%) respondents strongly agreed and agreed on the statement, respectively, while 18(8.3%) were indecisive. However, 25(11.5%) and 35(16.1%) disagreed with the assertion. From this analysis, it is clear that most of the respondents agree with these dimensions of the research model.
Descriptive Statistics
A preliminary analysis of the data collected from the field was conducted using several descriptive statistics. Descriptive statistics were employed to check the behaviour of the data for inferential statistics analysis.
Table 5: Descriptive Statistics
| N | Minimum
Statistic |
Maximum | Mean | Std. Deviation | Skewness | Kurtosis | ||||
| Statistic | Statistic | Statistic | Statistic | Statistic | Std. Error | Statistic | Std. Error | |||
| Income | 217 | 1.00 | 5.00 | 3.8249 | 1.27538 | -.870 | .165 | -.476 | .329 | |
| Income | 217 | 1.00 | 5.00 | 3.7512 | 1.25566 | -.950 | .165 | -.089 | .329 | |
| Income | 217 | 1.00 | 5.00 | 3.7696 | 1.22942 | -1.030 | .165 | .108 | .329 | |
| Occupation | 217 | 1.00 | 5.00 | 3.8387 | 1.14130 | -.867 | .165 | -.200 | .329 | |
| Occupation | 217 | 1.00 | 5.00 | 3.8295 | 1.21467 | -.983 | .165 | .028 | .329 | |
| Occupation | 217 | 1.00 | 5.00 | 3.6267 | 1.39238 | -.669 | .165 | -.903 | .329 | |
| Customer Choice
Customer Choice Valid N (listwise) |
217
217 217 217 |
1.00
1.00 1.00
|
5.00
5.00 5.00
|
3.5115 3.6406
3.5115
|
1.46601 1.36416
1.44052
|
-.632
-.708 -.647
|
.165
.165 .165
|
-1.037
-.725 -.989
|
.329
.329 .329
|
|
The table presents the information requested for each item used to measure the study’s variables. The following two columns show the minimum and the highest under maximum is five, while the least under minimum is 1. This a confirmation that the variables were measured with a five-point scale coded one to five. Also, from the table, all the items have a mean above 3; while most standard deviation values are above one. Standard deviations measure variability; hence, standard deviations above one indicate that the respondents’ opinions vary. Descriptive also provide information concerning the distribution of the scores on continuous variables, skewness, and kurtosis (Pallant, 2013). These are necessary if the variables are used in parametric statistical techniques (e.g. Pearson correlation, t-tests, among others), which is the situation in this study. The skewness value indicates the symmetry of the distribution.
Kurtosis, on the other hand, provides information about the “peakedness” of the distribution. Positive skewness values indicate scores clustered to the left at the low values. Negative skewness indicates a clustering of scores at the high end (right-hand side of a graph). Kurtosis values below 0 indicate a relatively flat distribution (too many cases in the extremes). With reasonably large samples, skewness will make a substantive difference in the analysis (Pallant, 2013). The skewness of the items is mixed with very high and shallow values. Also, the kurtosis shows very high and very low or values below zero. This implies a mix of peakedness and flattened values in the items. Tabachinick and Fidell (2013) maintain that with reasonably large samples (200+ cases), skewness ‘will not make a substantive difference in the analysis.’ The captive sample for this study is 217 respondents; hence skewness will not severely impact the analysis.
Factor analysis
Factor analysis is not a single technique but a family of statistical methods that can be used to identify the latent factors driving observable variables (Hair, Black, Babin, & Anderson, 2013).
Table 6: KMO and Bartlett’s Test
| Kaiser-Meyer-Olkin Measure of Sampling Adequacy. | .951 |
| Bartlett’s Test of Sphericity Approx. Chi-Square
Df Sig. |
9759.690
91 .000 |
Factor analysis was to check for the accuracy of the data and the internal consistency of the individual items used to measure the constructs. The Kaiser-Meyer-Olkin (KMO) Measure of Sampling Adequacy is .951 above the .5 benchmark while Bartlett’s Test of Sphericity has approximate Chi-Square value of 9759.690 with a degree of freedom (df) of 91 and ρ-value of .000 which well below the .05 margin of error. This means that the factor analysis is dependable hence we proceed with the test. We look at the list of commonalities.
Table 7: Communalities
| Initial | Extraction | |
| INCOME | 1.000 | .948 |
| INCOME | 1.000 | .960 |
| INCOME | 1.000 | .942 |
| OCCUPATION | 1.000 | .954 |
| OCCUPATION | 1.000 | .971 |
| OCCUPATION | 1.000 | .976 |
| CUSTOMERCHOICE | 1.000 | .976 |
| CUSTOMERCHOICE | 1.000 | .968 |
| CUSTOMERCHOICE | 1.000 | .976 |
Extraction Method: Principal Component Analysis.
Communalities refer to the amount of variance in a variable that is accounted for by the factors taken together. The size of the commonality is a useful index for assessing how much variance in a particular variable is accounted for by the factor solution. Higher communality values indicate that the factor solution has extracted a large amount of the variance in a variable (Hair, Black, Babin, & Anderson, 2013). All the items in our analysis load above .5; hence more than 50 % of the variance have been extracted for each item. The next is the table of total variance extracted.
Table 8: Total Variance Explained
| Component | Initial Eigenvalues | Extraction Sums of Squared Loadings | ||||
| Total | % of Variance | Cumulative % | Total | % of Variance | Cumulative % | |
| 1 | 13.448 | 96.054 | 96.054 | 13.448 | 96.054 | 96.054 |
| 2 | .210 | 1.500 | 97.553 | |||
| 3 | .100 | .714 | 98.267 | |||
| 4 | .062 | .440 | 98.707 | |||
| 5 | .046 | .328 | 99.035 | |||
| 6 | .027 | .193 | 99.228 | |||
| 7 | .024 | .172 | 99.401 | |||
| 8 | .007 | .051 | 99.923 | |||
| 9 | .006 | .042 | 99.965 | |||
| 10 | .005 | .035 | 100.000 | |||
Extraction Method: Principal Component Analysis.
The total variance extracted is based on achieving a specified cumulative percentage of total variance extracted by successive factors. It is not uncommon to consider a solution that accounts for 60 percent of the total variance as satisfactory. The total variance extracted is 96.054 which is very acceptable showing that the data has internal consistency.
Test of Hypotheses
Hypotheses One
Income has no significant influence on the choice of FMCGs of health care products.
| Table 9: Model Summaryb | |||||
| Model | R | R Square | Adjusted R Square | Std. Error of the Estimate | Durbin-Watson |
| 1 | .952a | .906 | .906 | .45019 | .202 |
The Model Summary (Table 9) indicate that R .952 i.e. simple correlation value representing the correlation between the actual scores of the dependent variable and the scores for the dependent variable predicted by the regression equation, the R squared .906 (which is simple square correlation value that if multiplied by 100 can be understood as a percentage to indicate that the independent variables account for 90.6% of the variance in the scores of the dependent variable), the Adjusted R square .906 and the Standard Error of the Estimate .45019. The Durbin Watson is .202 which indicates that the data has no redundant variable.
Table 10: ANOVAa
| Model | Sum of Squares | Df | Mean Square | F | Sig. |
| 1 Regression | 420.647
43.574 464.221 |
1 | 420.647 | 2075.509
|
.000b
|
| Residual | 215 | .203 | |||
| Total | 216 |
The next is the ANOVA (Table 10) which has F score of 2075.509 and is highly statistical significant at .000 below the .01 margin of error. This implies that the model was a good fit and that the coefficient of simple correlations R is significantly different from zero.
Table 11: Coefficientsa
| Model | Unstandardised Coefficients | Standardised Coefficients | t | Sig. | ||
| B | Std. Error | Beta | ||||
| 1 | (Constant) | -.674 | .097 | -6.958 | .000 | |
| INCOME2 | 1.094 | .024 | .952 | 45.558 | .000 | |
The coefficients (Table 11) show a significant relationship and the hypotheses should be accepted in the alternate form. Income was found to have significant relationship with customer choice of FMCGs of health care products (β = .952; t = 45.558; P < .000)
Hypotheses Two
Occupation has no significant influence on the choice of FMCGs of health care products.
Table 12: Model Summaryb
| Model | R | R Square | Adjusted R Square | Std. Error of the Estimate | Durbin-Watson |
| 1 | .947a | .897 | .896 | .43985 | .219 |
The Model Summary (Table: 12) indicate that R .947 i.e. simple correlation value representing the correlation between the actual scores of the dependent variable and the scores for the dependent variable predicted by the regression equation, the R squared .897 (which is simple squared correlation value that if multiplied by 100 can be understand as a percentage to indicate that the independent variables account for 89.7% of the variance in the scores of the dependent variable), the Adjusted R square .896 and the Standard Error of the Estimate .43985. The Durbin Watson is .219 which indicates that the data has no redundant variable.
Table 13: ANOVAa
| Model | Sum of Squares | Df | Mean Square | F | Sig. | |
| 1 | Regression | 360.367 | 1 | 360.367 | 1862.627 | .000b |
| Residual | 41.597 | 215 | .193 | |||
| Total | 401.963 | 216 | ||||
The ANOVA (Table 13) which has F score of 1862.627 and is highly statistical significant at .000 below the .01 margin of error. This implies that the model was a good fit and that the coefficient of simple correlations R is significantly different from zero.
Table 14: Coefficientsa
| Model | Unstandardised Coefficients | Standardised Coefficients | t | Sig. | ||
| B | Std. Error | Beta | ||||
| 1 | (Constant) | -.704 | .105 | -6.704 | .000 | |
| OCCUPATION1 | 1.132 | .026 | .947 | 43.158 | .000 | |
The coefficients (Table 14) show a significant relationship and the hypotheses should be accepted in the alternate form. Occupation was found to have significance relationship with the customer choice of FMCGs of health care products. (β = .947; t = 43.158; P < .000)
The coefficients show a significant relationship and the hypotheses should be accepted in the alternate form. Educational qualification has significant relationship with the customer choice of shopping FMCGs of health care product (β = .962; t = 51.542; P < .000)
The study of the social class and choice of fast moving consumer goods (FMCGs) among women in Southeast opened up to the findings that spurs the reader to having a different views on how women in Southeast go for FMCGs.
Hypothesis one has it that income has significant influence on the choice of FMCGs of health care products. The upshot in the table 4.3 indicated that customer income has significant relationship with customer choice (β = .952; t = 45.558; P < .000). The relationship that exists between customer income and customer choice is shown to be significant at 0.000 significant levels. Based on these guidelines the researcher rejected the null hypothesis and accepted the alternate hypothesis. This hypothesis is in line with the study of Engzell & Mood (2021) where they concluded that income can be very mobile hence its increase or decrease does not really affect choice in women. Most health care products used by women are averagely about the same cost except for women with abnormalities. This means that social class might not really be affected by income when it comes to buying, thus making income not a factor in consumption behavior of women (Engzell & Mood, 2021). O’ Cass (2004) is of the opinion that the extent to which the consumer is involved in making a purchase is influenced by their monetary outlay and social implications of product usage. This means that most ladies will hardly want to purchase FMCGs when they do not have enough money to afford it. Hence the alternate hypothesis was accepted.
Meaning there is a significant relationship between customer income and choice.
Hypothesis two states that occupation has significant influence on the choice of FMCGs of health care products. The Table 14 indicates that customer occupation has statistical relationship with choice (β = .947; t = 43.158; P < .000). The relationship that exists between customer occupation and choice is shown to be significant at 0.000 significant levels. Based on these guidelines the researchers rejected the null hypothesis and uphold the alternate hypothesis. Occupation really changes the feminine characteristics of a woman, it can only alter her levels of commitment and work life balance. So, among the women in Southeast it is more about the health care products available than the influence gotten from the woman’s occupation. Hence the alternate hypothesis was accepted. Meaning there is a significant relationship between customer occupation and choice. This is in line with Kraus, Piff and Keltner (2011) as they specifically classified social class by three variables namely: Income and Occupation. In line with the occupation part of social class they believe that ladies with certain job positions and functions could purchase certain FMCGs to suit her work needs. So while a lady working in a production site needs to purchase some medication for her health condition her other counter parts in other industries might not be needing the same medications.
Summary of Findings
Drawing from the discussion of findings above, the following summary was deduced;
Conclusion
Women work their way to attaining a good occupation that will give them the income to be able to purchase the healthcare products they desire. In line with the findings of this research, her income and occupation has significant relationship with the choice of the healthcare products that she buys.
Furthermore, a woman’s world is a bit different and to a great extent governed by her emotions, to this effect there are other factors that influence most women’s buying decisions in the purchase of heatlhcare which are different from the variables discussed in this study. In line with this study, women’s buy decisions can be largely influenced by the prices of products and the social class which they belong. However, friends and brand ambassadors are other factors that can affect the woman’s buying decision.
Recommendations
Area for Further Studies