The Impact of Service Quality and Educational Costs on School Selection Decisions: The Mediating Role of Brand Image in SD IT Cahaya Hati Pauh Kambar
Dwi Nasri Gunia, Reni Yuliviona, listiana sri mulatsih
Master of Science in Management Study Program Faculty of Economics and Business, Universitas Bung Hatta, Indonesia
This study investigates the factors influencing school selection decisions among parents at SD IT Cahaya Hati Pauh Kambar. The research focuses on the effects of service quality and educational costs on the decision-making process, with brand image acting as a mediating variable. Data was collected from 246 parents through a structured questionnaire. The findings reveal that both service quality and educational costs have a significant impact on parents’ school selection decisions, with brand image playing a crucial role in mediating these relationships.
Keywords: Service Quality, Education Cost, School Selection Decision, Brand Image, SDIT Cahaya Hati Pauh Kambar
Education plays a crucial role in enhancing human resource quality, which is why the government places great importance on this matter. According to the National Education System Law No. 20 of 2003, basic education in Indonesia is mandatory for all children, whether through public or private schools. In recent years, private schools have become an increasingly popular choice for parents seeking alternatives for their children’s education. This is because private schools generally offer advantages in terms of teaching quality, more flexible curricula, individual attention to students, and better facilities.
In West Sumatra, there are 4,260 elementary schools with a total of 102,702 students (BPS 2022, 2023). In the Padang Pariaman district, there are 418 schools, consisting of 401 public schools and 17 private schools. Among these, SD IT Cahaya Hati Pauh Kambar, a private school, has the largest number of students, with 638 enrolled (Dapodikdasmen, 2023). Islamic Integrated Elementary Schools (SDIT) offer education that is not only of high academic quality but also focuses on character development and religious faith. The integrated Islamic education approach aims to combine general knowledge with Islamic values, creating students who are intellectually intelligent as well as morally upright. This is reflected in the SDIT curriculum, which integrates Islamic education with other subjects like mathematics, science, and language, allowing students to see the relationship between knowledge and religious teachings (Mulyana, 2019).
The decision to choose a school is also closely related to parents’ perceptions of the quality of education their children will receive. Setiawan (2018) explains that purchasing decisions are influenced by consumers’ perceptions of the quality and benefits they will receive. In this case, parents compare various schools based on factors such as curriculum, teaching quality, school reputation, and available facilities. The higher the perception of quality that parents have of a school, the greater the likelihood that they will choose that school. The quality of service at educational institutions encompasses various aspects, including teacher-student interaction, available facilities, and the educational programs offered. According to Anggraini et al. (2024), good school service quality can increase parental satisfaction. When parents are satisfied with the services provided, they are more likely to recommend the school to others and more likely to make the purchasing decision to enroll their children.
In addition to service quality, price is also an important consideration for parents. The cost of education must be competitive with other educational institutions without compromising the quality offered. A reasonable cost can influence parents’ perceptions of quality and their purchasing decisions (Kotler & Armstrong, 2018). This is supported by research conducted at SMK Analis Kesehatan Tunas Medika, which found a positive relationship between service quality and cost in influencing purchasing decisions (Erinawati & Syafarudin, 2021). The decision to select a school is an important stage in the life of a student and their family. This choice is not only related to the quality of education received but also to the development of character, personality, and the student’s preparedness to face future challenges. In this context, the school’s brand image plays a very important role (Pranoto et al., 2022).
A school’s brand image encompasses parents’ perceptions of the school’s reputation, excellence, and the value it provides. Research conducted by Jamaludin & Bambang (2024) at Jaya Buana Vocational High School in Tangerang Regency shows that brand image positively mediates the relationship between service quality and purchasing decisions. Similarly, at Sekolah Tinggi Ilmu Ekonomi Stan Im, brand image positively mediates the relationship between cost and purchasing decisions (Ritonga, 2024).
Further research by Kumoro & Krisprimandoyo (2023) on schools in the Ciputat area examined the variables of service quality, reputation, and price as independent variables, with purchasing decisions as the dependent variable and consumer satisfaction as the mediating variable. Their findings indicate that service quality positively affects purchasing decisions. Other studies, including research conducted at Yamaha Music School in Makassar (Hasan & Ass, 2020) and SMK Analis Kesehatan Tunas Medika (Erinawati & Syafarudin, 2021), support these findings. In 2024, a study analyzing the impact of facilities and costs on purchasing decisions, mediated by brand image, was conducted in a religious-based primary school in Batam, with results indicating a positive effect (Lidia et al., 2024). Additionally, Nawawi et al. (2024) conducted research on a religious-based school at Pondok Pesantren Nurul Huda Kertawangunan, covering SMPIT, MA, and SMAIT, and found that brand image successfully mediated the relationship between service quality and purchasing decisions.
Purchase Decision
A purchase decision is part of consumer behavior, involving the process of selecting products or services. This decision is influenced by internal factors, such as consumers’ perceptions of quality and price, as well as external factors, like social and environmental situations. According to Mangkunegara (2019) and Tjiptono (2020), the purchase decision involves a process from before to after the purchase. Factors affecting purchase decisions include service quality, price, and brand image. Good service quality and appropriate pricing can increase customer satisfaction and strengthen purchase decisions. Brand image also plays a crucial role in influencing purchase decisions, with schools that have a strong reputation being more likely to be chosen by parents (Hasan & Ass, 2020; Nuraini et al., 2023).
Importance of Purchase Decisions
Purchase decisions affect sales, customer loyalty, and product differentiation in the market. Positive purchase decisions can increase sales and customer loyalty. Loyalty is created from positive experiences, leading to repeat purchases and recommendations. Furthermore, purchase decisions also influence a product’s position in the market and can enhance product differentiation compared to competitors (Schiffman & Kanuk, 2010; Indrasari, 2019).
Service Quality
Service quality is consumers’ perception of how well the service they receive meets their expectations. Parasuraman et al. (1988) state that service quality is the difference between customer expectations and the performance they experience. Service quality is a crucial factor in marketing because it impacts customer satisfaction and loyalty. Factors such as technology, responsiveness, reliability, customer engagement, and accessibility are key dimensions of service quality (Ladhari et al., 2017).
Importance of Service Quality
Good service quality increases customer satisfaction, which, in turn, boosts loyalty and profitability. Additionally, service quality strengthens a company’s competitive position in the market. Satisfied customers are more likely to make repeat purchases and recommend the product to others, thereby enhancing the company’s reputation (Kotler & Keller, 2016; Parasuraman et al., 2018).
Price
Price is the value paid by consumers for products or services. Factors influencing price include the state of the economy, supply and demand, competition, and cost (Sumarwan, 2019; Dharmmesta & Irawan, 2015). The right price influences purchase decisions and profitability. If the price is perceived as reasonable for the benefits received, consumers are more likely to make the purchase (Monroe, 2003).
Importance of Price
Price plays a critical role in purchase decisions, market positioning, and company profitability. Competitive pricing can make a product more attractive in a particular market segment. A well-structured pricing strategy helps companies achieve profits without losing customer appeal (Kotler & Keller, 2016; Hinterhuber, 2017).
Brand Image
Brand image is the perception shaped by past experiences and information about a product or company. Factors that form brand image include quality, trust, service, cost, and consequences (Keller & Swaminathan, 2020). A positive brand image creates customer loyalty, differentiates products from competitors, and enhances the company’s value.
Importance of Brand Image
A strong brand image enhances customer loyalty and creates a competitive edge. Brands with positive images are often chosen by consumers, and they can increase profit margins and the company’s leverage in the market (Aaker, 1991; Kotler & Keller, 2016). Brand image also influences consumer purchase decisions, especially when they have limited information to directly compare products (Barwise & Farley, 2005).
The Impact of Service Quality on School Selection Decisions
Service quality refers to the total ability of a product to meet established needs (Muafatun et al., 2022). Studies have shown a positive relationship between service quality and purchase decisions, indicating that higher service quality leads to better decisions (Ambiya et al., 2024; Hayati, 2021; Indriyani et al., 2023). Schools should focus on improving service quality, especially in areas like teacher quality and administrative services, to influence parents’ decisions (Pratama & Anggrainie, 2022). Thus, the hypothesis is: H1: Service quality positively affects the decision to choose a school.
The Impact of Education Costs on School Selection Decisions
Price is a key factor in purchase decisions, with studies showing that appropriate pricing increases purchase decisions (Amri & Yahya, 2021; Erinawati & Syafarudin, 2021; Lubis & Hamdan, 2020). In the education sector, the cost of education significantly influences parents’ choice of school (Siti Lailatul Fitriyah, 2023). Therefore, the hypothesis is: H2: Education costs positively affect the decision to choose a school.
The Impact of Brand Image on School Selection Decisions
Brand image, formed by past experiences and information, influences purchasing decisions. Research indicates that a strong brand image positively impacts decisions (Arofah & Hasyim, 2024; Evi Husniati Sya’idah & Tontowi Jauhari, 2024; Hasan & Ass, 2020). Improving the school’s image can enhance parents’ choices, as seen in studies on SMPIT Luqman Al Hakim (Arofah & Hasyim, 2024). Thus, the hypothesis is: H3: Brand image positively affects the decision to choose a school.
The Impact of Service Quality on Brand Image
Improving service quality can enhance brand image (Putranto, 2022). Several studies show a positive relationship between service quality and brand image (Imran & Indrayani, 2020; Lubis & Hamdan, 2020). In education, better service quality leads to a stronger institutional brand, as shown in research on universities (Oktarina, 2021). The hypothesis is: H4: Service quality positively affects brand image.
The Impact of Education Costs on Brand Image
Price influences brand image, with studies showing that an appropriate price can enhance brand perception (Elsa Febrina Tarigan et al., 2023; Leksono & Herwin, 2017). In education, the cost of education plays a significant role in shaping the school’s image
Brand Image Mediates the Relationship Between Service Quality and School Selection Decision
Brand image strengthens the relationship between service quality and purchase decisions (Anas & Aini, 2024; Pranoto et al., 2022). Research shows that brand image mediates the impact of service quality on school selection (Anggraini et al., 2024). Thus, the hypothesis is: H6: Brand image mediates the relationship between service quality and school selection.
Brand Image Mediates the Relationship Between Education Costs and School Selection Decision
Studies show mixed results regarding whether brand image mediates the relationship between price and purchase decisions (Andini & Silitonga, 2022; Prawira et al., 2024). However, if brand image strengthens the relationship between price and purchase decisions, the hypothesis is: H7: Brand image mediates the relationship between education costs and the decision to choose a school.
The theoretical framework presented in Figure 1
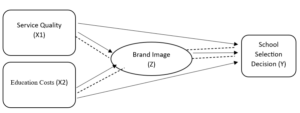
Figure 1: Theoretical Framework
This study is a quantitative research designed to examine the impact of service quality and education costs on school selection decisions, with brand image as a mediating variable.
Object, Population, and Sample
The object of this study is the parents of SD IT Cahaya Hati Pauh Kambar, located in Nagari Pauh Kambar, Padang Pariaman, West Sumatra. The population consists of 638 parents from the 2024/2025 academic year. Using Slovin’s formula, the sample size is determined to be 246. The sampling technique used is Proportionate Stratified Random Sampling, which proportionally selects samples from each grade level (Grades 1-6).
Data Type and Sources
Primary data was collected through questionnaires distributed to the parents of SD IT Cahaya Hati Pauh Kambar, focusing on service quality, price, brand image, and school selection decisions.
Operational definitions are provided for each variable:
Data Analysis Techniques
The results of the study began with presenting respondent profiles, which can be seen in the following table:
Table 1. The Profile of Participating Respondents
| Demographics | Category | Number of people) | Percentage (%) |
| Gender | Man | 102 | 75.6 |
| Woman | 33 | 24.4 | |
| Total | 246 | 100.0 | |
| Age | 17 – 27 Years | 8 | 3.3 |
| 28 – 37 Years | 38 | 15.4 | |
| 38 – 47 Years | 156 | 63.4 | |
| 48 – 57 Years | 30 | 12.2 | |
| >57 Years | 14 | 5.7 | |
| Total | 246 | 100.0 | |
| Education | Junior High School | 2 | 0.8 |
| High School | 28 | 11.4 | |
| S1 | 207 | 84.1 | |
| S2 | 9 | 3.9 | |
| Total | 246 | 100.0 | |
| Work | civil servant | 44 | 17.9 |
| Employee Private | 66 | 26.8 | |
| Businessman | 89 | 36.2 | |
| Housewife | 47 | 19.1 | |
| Total | 246 | 100.0 | |
| Number of children | 1 person | 23 | 9.3 |
| 2 persons | 182 | 74 | |
| 3 people | 22 | 8.9 | |
| 4 people | 14 | 5.7 | |
| 5 people | 5 | 2 | |
| Total | 246 | 100.0 | |
| Number of Children Studying at Cahaya Hati Pauh IT Elementary School Kambar | 1 person | 37 | 15 |
| 2 persons | 203 | 82.5 | |
| 3 people | 6 | 2.4 | |
| Total | 246 | 100.0 |
The table presents demographic data from 246 respondents, including categories such as gender, age, education, occupation, number of children, and the number of children attending SD IT Cahaya Hati Pauh Kambar. The majority of respondents are male (75.6%), with females making up 24.4%. The largest age group is 38–47 years (63.4%), followed by 28–37 years (15.4%). Most respondents have a Bachelor’s degree (84.1%), with only 0.8% having completed junior high school.
Regarding occupation, the majority are entrepreneurs (36.2%), followed by private employees (26.8%) and civil servants (17.9%). Additionally, 74% of respondents have two children, and most (82.5%) have children attending SD IT Cahaya Hati Pauh Kambar.
Measurement Model Assessment
Measurement Model Assessment (MMA) helps determine the relationship between statement items and constructs/variables with convergent and discriminant validities (Hair et al., 2014).
Table 2. The Results of Convergent Validity
| Valid Item
|
Outer Loadings | Cronbach’s Alpha | rho_A | Composite Reliability | Average Variance Extracted (AVE) | |
| Cost of education | 4 | 0.774-0.884 | 0.858 | 0.872 | 0.904 | 0.701 |
| Brand Image | 4 | 0.710-0.803 | 0.762 | 0.770 | 0.848 | 0.582 |
| Decision to Choose | 6 | 0.825-0.958 | 0.953 | 0.956 | 0.963 | 0.813 |
| Quality Service | 18 | 0.712-0.877 | 0.964 | 0.993 | 0.966 | 0.613 |
Based on Table 2, all statement items used to measure the variables of Education Costs, Brand Image, Choice Decisions, and Service Quality are valid, with outer loadings above 0.7. Table 4.5 shows that all variables meet the required criteria, with Cronbach’s alpha > 0.7, composite reliability > 0.7, and AVE > 0.5 (Hair et al., 2014).
Table 3. Results of Discriminant Validity-Fornell-Larcker Criterion
| Cost of education | Brand Image | Decision to Choose | Quality Service | |
| Cost of education | 0.837 | |||
| Brand Image | 0.292 | 0.763 | ||
| Decision to Choose | 0.388 | 0.439 | 0.901 | |
| Quality Service | 0.253 | 0.235 | 0.143 | 0.783 |
The discriminant validity analysis using the Fornell-Larcker criterion shows the correlations between the variables: Education Costs, Brand Image, School Choice Decision, and Service Quality. Education Costs has a high correlation with itself (0.837) but relatively low correlations with other variables: Brand Image (0.292), School Choice Decision (0.388), and Service Quality (0.253).
Brand Image has a strong correlation with itself (0.763) and moderate correlations with School Choice Decision (0.439) and Service Quality (0.235). School Choice Decision has a very strong correlation with itself (0.901) but a low correlation with Service Quality (0.143). Finally, Service Quality has a strong correlation with itself (0.783).
Table 4: The Results of Discriminant Validity -Cross Loadings
| Cost of education | Brand Image | Decision to Choose | Quality Service | |
| BP1 | 0.774 | 0.174 | 0.250 | 0.128 |
| BP2 | 0.853 | 0.236 | 0.361 | 0.242 |
| BP3 | 0.884 | 0.281 | 0.346 | 0.261 |
| BP4 | 0.835 | 0.271 | 0.327 | 0.195 |
| CM1 | 0.236 | 0.781 | 0.414 | 0.193 |
| CM2 | 0.211 | 0.803 | 0.324 | 0.212 |
| CM4 | 0.206 | 0.755 | 0.290 | 0.164 |
| CM5 | 0.237 | 0.710 | 0.292 | 0.143 |
| KM3 | 0.397 | 0.390 | 0.873 | 0.103 |
| KM4 | 0.337 | 0.437 | 0.958 | 0.168 |
| KM5 | 0.337 | 0.441 | 0.923 | 0.136 |
| KM6 | 0.315 | 0.384 | 0.930 | 0.122 |
| KM7 | 0.425 | 0.356 | 0.825 | 0.080 |
| KM8 | 0.266 | 0.354 | 0.894 | 0.170 |
| KP1 | 0.249 | 0.327 | 0.237 | 0.770 |
| KP10 | 0.246 | 0.156 | 0.095 | 0.847 |
| KP11 | 0.223 | 0.158 | 0.113 | 0.839 |
| KP13 | 0.245 | 0.186 | 0.156 | 0.738 |
| KP14 | 0.254 | 0.180 | 0.145 | 0.761 |
| KP15 | 0.188 | 0.109 | 0.059 | 0.815 |
| KP16 | 0.226 | 0.167 | 0.121 | 0.877 |
| KP17 | 0.239 | 0.185 | 0.129 | 0.857 |
| KP18 | 0.175 | 0.098 | 0.066 | 0.763 |
| KP2 | 0.175 | 0.192 | 0.064 | 0.755 |
| KP21 | 0.162 | 0.066 | 0.033 | 0.712 |
| KP22 | 0.171 | 0.082 | 0.048 | 0.734 |
| KP3 | 0.145 | 0.266 | 0.120 | 0.721 |
| KP4 | 0.154 | 0.105 | 0.030 | 0.794 |
| KP5 | 0.113 | 0.129 | 0.049 | 0.779 |
| KP6 | 0.138 | 0.148 | 0.053 | 0.778 |
| KP7 | 0.147 | 0.146 | 0.060 | 0.810 |
| KP9 | 0.143 | 0.166 | 0.084 | 0.719 |
Based on the results in Table 4, we can observe the relationship between indicator items and their respective variables. Education Costs (BP): The outer loading values for Education Costs are sufficiently high, with BP3 (0.884) and BP2 (0.853) demonstrating a strong relationship with the Education Costs variable. Brand Image (CM): In the case of Brand Image, indicators such as CM2 (0.803) and CM1 (0.781) also show high outer loading values, indicating a strong influence on the Brand Image variable. Decision to Choose (KM): The Decision to Choose variable shows very high outer loading values on its indicators, such as KM4 (0.958), KM5 (0.923), and KM6 (0.930), indicating that this variable is dominant in influencing the decision-making process. Quality Service (KP): For the Quality Service variable, indicators like KP10 (0.847), KP11 (0.839), and KP16 (0.877) show high outer loading values, suggesting that the Quality Service variable plays a significant role in shaping customer perceptions. Overall, this table provides insight into the extent of the influence each variable has on its respective indicators, which is crucial for further analysis in the study.
Table 5. The Results of Discriminant Validity-Heterotrait-Monotrait Ratio
| Cost of education | Brand Image | Decision to Choose | Quality Service | |
| Cost of education | ||||
| Brand Image | 0.354 | |||
| Decision to Choose | 0.419 | 0.504 | ||
| Quality Service | 0.257 | 0.234 | 0.125 |
Hair (2014) recommends using the Heterotrait-Monotrait Ratio (HTMT) for discriminant validity because it is more sensitive and accurate. A value below 0.90 indicates that discriminant validity is met. The HTMT test results show that the relationships between constructs are below 0.90, confirming discriminant validity. The low correlation values suggest that each variable has distinct and independent effects. Specifically, the brand image has a moderate correlation with education cost (0.354) and decision-making (0.504), while its correlation with service quality (0.234) is lower. Decision-making shows a higher correlation with brand image and education cost but a very low correlation with service quality (0.125), indicating that decision-making is more influenced by education cost and brand image than by service quality. Overall, the constructs in the research model have adequate discriminant validity, allowing for further hypothesis testing without multicollinearity concerns.
Table 6. R Square
| R Square | Description | |
| Decision to Choose | 0.267 | Weak |
| Brand Image | 0.113 | Weak |
Based on table 4.14 can seen that variable decision choose has an R square (R 2 ) of 0.267 which can interpreted that the magnitude influence quality service , cost education , image brand to decision choose is 26.7% and is classified as into the category weak . (Hair dkk., 2014). Next , the variable ambition brand has an R 2 of 0.113 and can interpreted that the magnitude influence quality services and costs education to image brand by 11.3% and is classified as into the category weak (Hair dkk., 2014).
Structural Model Assessment
Structural model assessment (SMA) is used to understand the influence of one or several variables on other variables. The results of the SMA with the bootstrapping method are as follows:
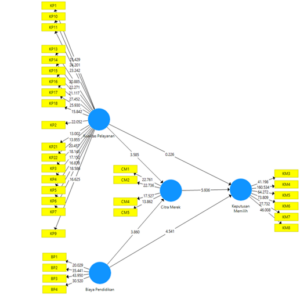
Figure 2: Structural Model Assessment
Table 7. The Results of Direct Relationship
| Original Sample (O) | T Statistics | P Values | Hypothesis | |
| Quality Service -> Decision to Choose | -0.014 | 0.226 | 0.822 | H1 rejected |
| Quality Service -> Brand Image | 0.172 | 3,585 | 0,000 | H2 accepted |
| Costs -> Decision to Choose | 0.287 | 4,541 | 0,000 | H3 accepted |
| Cost -> Brand Image | 0.249 | 3,860 | 0,000 | H4 accepted |
| Brand Image -> Decision to Choose | 0.358 | 5,936 | 0,000 | H5 received |
Based on Figure 2 and Table 7, the following interpretations can be made:
Table 8. The Results of the Mediating Effect
| Original Sample (O) | T Statistics | P Values | Hypothesis | |
| Quality Service -> Brand Image -> Decision to Choose | 0.062 | 3,076 | 0.002 | H6 accepted |
| Cost -> Brand Image -> Choice Decision | 0.089 | 2,820 | 0.005 | H7 accepted |
Based on Figure 4.1 and Table 4.17, it can be interpreted as follows:
Based on the research results and discussions that have been presented previously, several conclusions can be presented in this study as follows: