The Nutritional Impact and Academic Outcomes of School Based Feeding Program in Elementary Schools of Tandag City
Joel V. Cubio, MST
Head Teacher I, Purok Narra, Mabua, Tandag City, Surigao del Sur 8300, Philippines
The School-Based Feeding Program (SBFP) is crucial in addressing malnutrition and food insecurity which significantly affect students’ academic success (WHO, 2020). This DepEd initiative aimed to provide nutritional support, improve health, and foster an environment for enhanced academic engagement (Grantham-McGregor & Baker-Henningham, 2007; Department of Education, 2021; PIDS, 2022). This study examined the implementation of the School Based Feeding Program (SBFP) in Tandag City Division for school year 2023–2024 which aimed to address malnutrition, improve academic performance, enhance school attendance, and promote student well-being. The program provided nutritional support and related health interventions to improve outcomes for students. A mixed-methods approach was used that combined qualitative data from focus group discussions with 30 informants, including teachers, parents, and community stakeholders, and quantitative data from program records, terminal reports, and structured surveys.
Thematic analysis of qualitative data revealed recurring themes such as parental engagement, meal quality, infrastructure, health and nutrition, community partnerships, program management, accessibility, student engagement, logistics, and training. Quantitative findings indicated that program implementers were rated “Very Satisfactory” to “Outstanding,” highlighted their critical role. The SBFP significantly improved student energy levels, motivation, academic performance 60% of 192 severely wasted and attendance, with attendance rates rising from 96.57% to 98.86% post-implementation[*]. Additionally, the rehabilitation rate for severely wasted learners reached 65.10%, showed a notable progress. However, challenges such as inadequate facilities, occasional food preference issues, and limited parental involvement were identified.
Key recommendations included diversifying meal options, upgrading facilities, strengthening community partnerships, and incorporating health monitoring and nutrition education. Enhancing parental engagement, increasing vegetable acceptance, and involving students in participatory activities were also emphasized. These findings provided actionable insights to improve the SBFP in Tandag City division and offered a framework to address malnutrition and improved educational outcomes in similar contexts.
Keywords: School-Based Feeding Program (SBFP), Severely Wasted Learners, Rehabilitation Rate, Parental Engagement, Community Partnerships
Malnutrition, defined as the deficiency, excess, or improper utilization of essential nutrients, significantly impairs children’s neurological development and behavioral capabilities, negatively affecting both cognitive and motor skills (Dukhi, 2020; Zerga et al., 2022). This condition is particularly detrimental to academic performance, as malnourished children often face diminished learning abilities, higher absenteeism rates, and a decline in overall academic success (Webb et al., 2018; Zerga et al., 2022). The repercussions of malnutrition extend beyond the classroom, influencing children’s emotional, social, and physical development, which in turn can perpetuate a cycle of poverty and inequality.
In Tandag City Division, malnutrition remained a critical public health issue, especially among school-aged children, exacerbating the challenges faced by educators in delivering quality education (Webb et al., 2018). According to recent data, 236 elementary learners are classified as severely wasted during the 2023–2024 school year, which underscores the immediate need for interventions that address both malnutrition and educational disparities (United Nations General Assembly, 2015). The intersection of these two crises—malnutrition and educational inequality—presents a barrier to achieving the United Nations Sustainable Development Goal of providing inclusive, equitable, and quality education for all (United Nations General Assembly, 2015).
Globally, school-based feeding programs have shown considerable success in mitigating the adverse effects of malnutrition, improving the nutritional status of students, and enhancing their academic performance (Dukhi, 2020; Webb et al., 2018). These programs not only provide essential nutrients that help to boost energy levels and concentration but also contribute to the holistic well-being of children, supporting their emotional and social development (World Food Programme, 2019). Aligned with the United Nations Sustainable Development Goals (SDGs), particularly the goal of achieving inclusive, equitable, and quality education (United Nations General Assembly, 2015), the School-Based Feeding Program (SBFP) in Tandag City Elementary Schools was designed to tackle the pressing issue of malnutrition and its detrimental effects on both physical and cognitive development.
The SBFP, by providing nutritious meals during school hours, presents a sustainable and practical solution to combat severe wasting and promote healthy growth and development in vulnerable children. Beyond addressing immediate hunger, this program aims to foster long-term improvements in health and learning outcomes, as improved nutrition is directly linked to enhanced cognitive functions, greater school attendance, and better academic achievement (Grantham-McGregor et al., 2007). The feeding program also has broader social and economic benefits, contributing to reducing healthcare costs associated with malnutrition and ensuring that children are better equipped to contribute to society in the future.
This study examined the effectiveness, challenges, and impact of the SBFP in Tandag City, focusing on its nutritional benefits for students, community and parental involvement, and operational sustainability. It identified key areas for improvement and offered evidence-based recommendations to enhance the program. The goal was to optimize SBFP for better educational outcomes and child health, while providing insights to support its replication in other regions combating malnutrition and promoting educational equity.
Research Questions
This study aimed to evaluate the implementation of the School Based Feeding Program (SBFP) in all elementary schools in the Tandag City Division. The research addressed the following questions:
To what extent has the SBFP achieved its objectives, specifically in the following areas:
How could the nutritional status of beneficiaries be described in terms of:
What were the problems encountered in the implementation of the SBFP?
What plan of action can be proposed to improve the implementation of the SBFP based on the findings?
Scope and Limitation
This study aimed to evaluate the School-Based Feeding Program (SBFP) implemented in all elementary schools under DepEd Tandag City during the 2023–2024 school year that focused on its impact on students’ academic performance, nutritional health, and the overall implementation process. Feedback was gathered from a wide range of stakeholders, including students, parents, teachers, school administrators, local government officials, and community members to gain insights into their experiences, perceptions, and suggestions for improvement. It also identified challenges and barriers in the program’s implementation, as well as best practices and key success factors. Based on the findings, action plans, strategies, and recommendations were proposed to support the development of an operational manual, implementation guidelines, and innovative approaches to enhance the SBFP’s effectiveness and sustainability.
Objective of the Study
Based on the research questions, the main objective was to evaluate the effectiveness, challenges, and impact of the School-Based Feeding Program (SBFP) in Tandag City and provide evidence-based recommendations to enhance its support for student health and academic success.
School-Based Feeding Programs (SBFPs) are used worldwide to combat malnutrition and boost school outcomes like attendance and completion (Assefa et al., 2020). While effective in improving nutrition and learning (Webb et al., 2018), challenges such as logistics, food quality, and limited funding hinder full success (Alcantara & Frontreras, 2024).
Malnutrition remains a serious issue in the Philippines, with 3.4 million stunted children and over 300,000 severely wasted (Rivera, 2017). Stunting affects 28.8% of children under five, contributing to economic losses of 1.5% of GDP due to poor productivity and health costs (World Bank, 2021; Business World, 2023). Despite long-standing efforts, stunting rates remain unchanged, highlighting the need for stronger, coordinated interventions.
Globally, undernutrition—including stunting, wasting, and micronutrient deficiencies—remains widespread (Zerga et al., 2022). Iodine deficiency affects nearly 30% of school-aged children worldwide (Andersson, 2012), with higher rates in India and Africa. In Ethiopia and the Philippines, significant portions of schoolchildren are stunted or underweight, stressing the urgency of nutrition-focused programs (Assemie et al., 2020).
Malnutrition severely affects cognitive and academic performance. A 2024 study found a moderate negative correlation (r = -0.55) between malnutrition and school performance (K. A. et al., 2024). In the Philippines, malnourished students show reduced attentiveness and learning abilities (Zerga et al., 2022). Feeding programs have been shown to improve academic scores, emphasizing the importance of nutrition in education (Alcantara & Frontreras, 2024; Webb et al., 2018).
This chapter described the methods used to address the problems identified in the study. It covered the research design, the participants involved, the methods used to collect data, the plans for analysing the data, and the statistical techniques applied to interpret the results.
Research Design
The present study employed a mixed – methods approach of qualitative and quantitative to comprehensively evaluate the SBFP implementation in DepEd Tandag City.
Sampling and Participants
A purposive sampling technique was used to select participants for both the survey and qualitative data collection that ensure representation from a variety of elementary schools, grade levels, and demographic groups. For the quantitative data, surveys were conducted with 97 respondents which include elementary school heads, parents, teachers or class advisers, Barangay Local Government Unit (BLGU) officials, and program administrators. For the qualitative data, purposive sampling was also applied to select the select key informants for in-depth interviews and focus group discussions (FGDs) based on their roles, expertise, and involvement in the SBFP. This approach ensured comprehensive insights into the program’s implementation from multiple perspectives.
Data Collection Procedure
Quantitative data were collected through surveys administered to 97 respondents, comprising 27 elementary school heads, 25 parents, 30 teachers or class advisers, 15 Barangay Local Government Unit (BLGU) officials, and 10 program administrators. The surveys focused on key aspects of the SBFP, including program coverage, duration, personnel involvement, financial allocation, facilities, complementary activities, strategies, goals, and challenges encountered during implementation. In addition, qualitative data were gathered through in-depth interviews and focus group discussions (FGDs) with 30 selected informants. These qualitative methods allowed for a deeper exploration of participants’ perspectives, experiences, and suggestions regarding the implementation and impact of the SBFP.
Data Analysis
For quantitative data analysis, descriptive statistics such as frequencies, percentages, and means were utilized to analyse survey data. Statistical tests (e.g., t-tests) were applied to identify associations and differences between variables. Additionally, charts were used to visually represent the data, helping to illustrate key findings and trends in a clear and accessible manner. In relation to the School Based Feeding Program’s (SBFP) implementation, strategies and performance of the personnel, the researchers used the following scale:
Table 1 Scale for SBFP Implementation, Strategies, and Performance of Personnel
| Point Scale | Index Limit | Descriptive Rating |
| 5 | 4.50-5.00 | Outstanding |
| 4 | 3.50-4.49 | Very Satisfactory |
| 3 | 2.50-3.49 | Satisfactory |
| 2 | 1.50-2.49 | Fair |
| 1 | 1.00-1.49 | Poor |
Table 2 SBFP Resources, Financial and Facilities Point Scale
| Point Scale | Index Limit | Descriptive Rating |
| 5 | 4.50-5.00 | Very Adequate |
| 4 | 3.50-4.49 | Adequate |
| 3 | 2.50-3.49 | Moderately Adequate |
| 2 | 1.50-2.49 | Inadequate |
| 1 | 1.00-1.49 | Very Inadequate |
For the attainment of program goals questions and implementation of the complimentary activities, the researcher gave the descriptive ratings in the questionnaire to help the respondents fully understand the questions. A corresponding numerical equivalent for the scale was presented in the questionnaire. For the mean level of evaluation on the attainment of program goals and level of implementation of the school-based feeding, a 5-point scale was used. The mean level was determined by getting the total of the observations divided by the total number of observations. The scale as follows: 5 – (81-100%) or very high implementation/fully attained, 4 – (61-80%) high implementation/almost fully attained, 3 – (41-60%) or moderate implementation/moderately attained, 2 – (21-40%) or less implementation/slightly attained and 1 – (0-20%) or least implementation/poorly attained. The sample Mean was computed using the formula: X=E Y/N, where; X = the mean, E = Summation, Y = the raw scores in a set of scores, N = the total number of scores in a set. The rubric scale is as follows:
Table 3 Scale for the attainment of program goals and outcomes
| Numerical Rating | Interpretation |
| 5 | Attained 81-100% Very High Implementation/Fully Attained |
| 4 | Attained 61-80% High Implementation/Almost Fully Attained |
| 3 | Attained 41-60% Moderate Implementation/Moderately Attained |
| 2 | Attained 21-40% Less Implementation/Slightly Attained |
| 1 | Attained 0-20% Least Implementation/Poorly Attained |
For the problems encountered in the SBFP implementation, the responses of the respondents were summed up and categorized as follows:
Table 4 Scale for Problems Encountered in the SBFP
| Point Scale | Percentage | Interpretation |
| 5 | 81-100% | Always a problem |
| 4 | 61-80% | Almost always a problem |
| 3 | 41-60% | Occasionally a problem |
| 2 | 21-40% | Seldom a problem |
| 1 | 0-20% | Never a problem |
For the qualitative data analysis, thematic analysis was employed to interpret data collected from interviews and focus group discussions (FGDs). The data were systematically coded, categorized, and analysed to uncover recurring themes, patterns, and insights aimed at enhancing the implementation of the SBFP. To support these findings, an infographic was developed to illustrate key themes and actionable recommendations for improving the program. This visual representation effectively summarized the qualitative insights, making it easier to communicate critical points and engage stakeholders in understanding the areas requiring attention for future program enhancements.
Ethical Consideration
Before participating in the study, all participants received clear information about the research’s purpose, procedures, potential risks, and benefits. They had time to review the consent form and ask questions before providing voluntary consent, with written consent for those able and verbal consent for those with literacy or language barriers. To ensure confidentiality, personal information was kept secure and anonymized. Only authorized research team members had access to identifiable data, which was used solely for research purposes. Participants’ rights, dignity, and well-being were prioritized, and they could withdraw at any time without consequence. Any concerns raised were addressed promptly, and cultural sensitivity was maintained throughout the study.
SBFP Implementation and Evaluation
Table 5. SBFP Coverage Indicators with Point Scale Ratings and Descriptive Assessments of Program Implementation Effectiveness
| SBFP Coverage Indicators | Point Scale | Descriptive Rating |
| Meals Provided Regularly Each Week | 4.79 | Outstanding |
| Includes Students with Special Needs or Disabilities | 4.66 | Outstanding |
| Implemented in All Schools with Students in Need | 3.94 | Very Satisfactory |
| Covers Students from All Grade Levels | 4.03 | Very Satisfactory |
| Includes Severely Wasted or Undernourished Students | 4.20 | Very Satisfactory |
| Weighted Mean | 4.32 | Very Satisfactory |
Legend: The ratings in the table are based on a point scale ranging from 1 to 5, with the following descriptive assessments: 5 (4.50–5.00): Outstanding, 4 (3.50–4.49): Very Satisfactory, 3 (2.50–3.49): Satisfactory, 2 (1.50–2.49): Fair 1 (1.00–1.49): Poor
The School-Based Feeding Program (SBFP) was evaluated using implementation indicators with mean scores from 3.94 to 4.79, reflect ratings from “Very Satisfactory” to “Outstanding.” The highest-rated indicator, “Meals are provided to beneficiaries as planned” (M = 4.79), showed the program’s strong reliability in meal delivery that addressed student malnutrition (Webb et al., 2018). The focus on nutritionally deficient students also earned an “Outstanding” rating (M = 4.66), aligning with global standards (Dukhi, 2020; Zerga et al., 2022). However, indicators like “The SBFP includes all students” (M = 4.20) and “Implemented on schedule” (M = 3.94) were rated slightly lower, revealing areas for improvement in coverage and timeliness. These findings echo previous research noting that while SBFPs enhance nutrition and learning, delays and limited reach can reduce their effectiveness (Glewwe, 2007; Assefa et al., 2020). Thus, improving efficiency and inclusivity could boost the program’s overall impact (Alcantara & Frontreras, 2024).
Duration of SBFP Implementation
Table 6. Duration Indicators of SBFP Implementation with Point Scale Ratings and Descriptive Assessments
| Duration of the SBFP Indicators | Point Scale | Descriptive Rating |
| The SBFP runs consistently throughout the entire school year. | 3.97 | Very Satisfactory |
| Sufficient time is allocated each day for meal preparation and distribution to students. | 4.04 | Very Satisfactory |
| The duration of the feeding program allows for a noticeable improvement in student health. | 4.62 | Outstanding |
| Participating students or beneficiaries are enrolled to the program long enough to benefit from improved nutrition. | 4.89 | Outstanding |
| The daily meal service does not interfere with student’s learning schedules. | 4.46 | Very Satisfactory |
| Weighted Mean | 4.40 | Very Satisfactory |
Legend: The ratings in the table are based on a point scale ranging from 1 to 5, with the following descriptive assessments: 5 (4.50–5.00): Outstanding, 4 (3.50–4.49): Very Satisfactory, 3 (2.50–3.49): Satisfactory, 2 (1.50–2.49): Fair 1 (1.00–1.49): Poor
Table 6 assessed the duration of SBFP implementation, with mean scores ranging from 3.97 to 4.89, rated from “Very Satisfactory” to “Outstanding.” The highest-rated item, “Participating students complete the feeding cycle” (M = 4.89), reflected strong adherence to the program’s full duration, crucial for maximizing health and academic benefits (Webb et al., 2018; Alderman & Headey, 2014). “The duration is sufficient for its purpose” also earned an “Outstanding” rating (M = 4.62), supports the adequacy of the program’s length (Bhutta et al., 2013; Dukhi, 2020). Other indicators like “Sufficient time is allocated daily” (M = 4.04), “Meal service does not disrupt classes” (M = 4.46), and “Program runs consistently” (M = 3.97) were rated “Very Satisfactory,” suggests minor gaps in daily scheduling and consistency. Studies confirm that even small disruptions can hinder nutritional and academic outcomes (Zerga et al., 2022; Grantham-McGregor & Baker-Henningham, 2005). The relatively lower score for program consistency points to a need for improved planning to ensure uninterrupted service and sustained benefits (Glewwe, 2007; Masset & Gitter, 2016).
SBFP Resources: Personnel
The personnel involved in the SBFP implementation were program administrators, program implementers and beneficiaries (Pupil and parents). They are the front liners in the program implementation.
Table 7. Performance Ratings of Program Administrators in SBFP Implementation Across Key Indicators
| Program Administrators Indicators | Point Scale | Descriptive Rating |
| The school principal provides strong leadership and ensures that adequate resources are allocated for the feeding program. | 4.82 | Outstanding |
| The SBFP coordinator effectively manages day-to-day operations and communicates with staff and volunteers. | 4.32 | Very Satisfactory |
| The finance officer ensures that the feeding program operates within budget and financial reports are up to date. | 4.77 | Outstanding |
| Division focal person, district supervisors, and school heads provide clear guidelines and support to schools for consistent program implementation. | 4.81 | Outstanding |
| The nutrition program coordinator monitors the nutritional quality of the meals provided and regularly evaluates students’ health outcomes and suggests improvements. | 4.89 | Outstanding |
| Weighted Mean | 4.72 | Outstanding |
Legend: The ratings in the table are based on a point scale ranging from 1 to 5, with the following descriptive assessments: 5 (4.50–5.00): Outstanding, 4 (3.50–4.49): Very Satisfactory, 3 (2.50–3.49): Satisfactory, 2 (1.50–2.49): Fair 1 (1.00–1.49): Poor
Table 7 evaluated the role of Program Administrators in SBFP implementation, with mean scores from 3.66 to 4.89, rated “Very Satisfactory” to “Outstanding.” The top-rated indicator, “Nutrition coordinator monitors effectively” (M = 4.89), highlighted strong management, consistent with research linking monitoring to program success (Webb et al., 2018; Bhutta et al., 2013). Leadership and financial roles also earned high scores: principals (M = 4.82), finance officers (M = 4.77), and district supervisors (M = 4.81), showing the value of administrative support (Alcantara & Frontreras, 2024; Dukhi, 2020). However, “Coordinator manages daily operations” (M = 4.32) and “PTA officers support the program” (M = 3.66) were rated lower, indicating gaps in day-to-day management and community involvement (Glewwe, 2007; Grantham-McGregor et al., 2007). While leadership and oversight were strong, boosting operational efficiency and parental engagement could further enhance the SBFP’s effectiveness (Baffa et al., 2024; Hoddinott & Kinsey, 2001).
Table 8. Performance Ratings of Program Implementers in SBFP Implementation Across Key Roles
| SBFP Implementers Indicators | Point Scale | Descriptive Rating |
| Teachers or class advisers actively support and encourage student participation in the feeding program. | 4.48 | Very Satisfactory |
| The nutrition coordinators effectively monitor and evaluate student’s nutritional progress. | 4.49 | Very Satisfactory |
| School nurses or health aides regularly assess the health and nutritional status of participating students. | 4.69 | Outstanding |
| Canteen staff adhere to food safety and hygiene standards during meal preparation. | 3.87 | Very Satisfactory |
| Support staff maintain a clean and safe environment for the meal distribution process. | 4.61 | Outstanding |
| Weighted Mean | 4.43 | Very Satisfactory |
Legend: The ratings in the table are based on a point scale ranging from 1 to 5, with the following descriptive assessments:5 (4.50–5.00): Outstanding, 4 (3.50–4.49): Very Satisfactory, 3 (2.50–3.49): Satisfactory, 2 (1.50–2.49): Fair 1 (1.00–1.49): Poor
Table 8 showed high performance ratings for SBFP implementers, with most roles rated “Very Satisfactory” to “Outstanding.” Teachers received a 4.48 rating for encouraging student participation, while nutrition coordinators scored 4.49 for monitoring progress—both highlighting strong but improvable support (Glewwe, 2007; Masset & Gitter, 2016). School nurses earned the highest rating (4.69, “Outstanding”) for regularly assessing students’ health, reinforcing the critical role of health professionals (Grantham-McGregor et al., 2007). Support staff also scored “Outstanding” (4.61) for maintaining clean, safe meal environments (Webb et al., 2018; Dukhi, 2020). However, canteen staff scored lowest (3.87), indicating food safety practices need improvement. This gap suggests a need for enhanced training and stricter hygiene protocols to prevent health risks and maintain program effectiveness (Bhutta et al., 2013; Hoddinott & Kinsey, 2001). Overall, while SBFP implementation was strong, targeted improvements in food safety could further boost its impact.
Table 9. Evaluate Students’ Beneficiaries in SBFP Implementation Based on Key Indicators
| SBFP Students’ Beneficiaries Indicators | Point Scale | Descriptive Rating |
| Students’ beneficiaries enjoy the meals provided by the school feeding program. | 4.03 | Very Satisfactory |
| Students’ beneficiaries feel more motivated to participate in class after having meals from the program. | 4.55 | Outstanding |
| Students’ beneficiaries feel more energetic and focused during school hours. | 4.82 | Outstanding |
| The feeding program has helped improve the attendance and engagement of students who participate in it. | 4.29 | Very Satisfactory |
| The feeding program has helped improve the health and nutrition of the students’ beneficiaries. | 4.45 | Very Satisfactory |
| Weighted Mean | 4.43 | Very Satisfactory |
Legend: The ratings in the table are based on a point scale ranging from 1 to 5, with the following descriptive assessments:5 (4.50–5.00): Outstanding, 4 (3.50–4.49): Very Satisfactory, 3 (2.50–3.49): Satisfactory, 2 (1.50–2.49): Fair 1 (1.00–1.49): Poor
Table 9 showed positive impacts of the SBFP on student beneficiaries, with a mix of “Very Satisfactory” and “Outstanding” ratings. Students enjoyed the meals (M = 4.03), aligning with studies that link meal satisfaction to program participation (Webb et al., 2018). Motivation to participate in class improved (M = 4.55), and the highest-rated impact was increased energy and focus (M = 4.82), supporting research on the cognitive benefits of proper nutrition (Bhutta et al., 2013; Grantham-McGregor et al., 2007). The program also improved attendance (M = 4.29) and overall health (M = 4.45), reflecting its broader educational and nutritional benefits (Alcantara & Frontreras, 2024). While outcomes were strong, enhancements in meal quality and added health interventions, such as nutrition education, could further boost effectiveness (Dukhi, 2020; Masset & Gitter, 2016).
Table 10. Assess Parents’ Involvement and Perceptions in SBFP Implementation
| SBFP Parents of Beneficiaries Indicators | Point Scale | Descriptive Rating |
| Regular Updates on Progress | 3.74 | Very Satisfactory |
| Support for the SBFP | 3.79 | Very Satisfactory |
| Perceived Academic Improvement | 4.36 | Very Satisfactory |
| Awareness of Objectives and Benefits | 4.38 | Very Satisfactory |
| Availability for Meal Preparation | 4.09 | Very Satisfactory |
| Weighted Mean | 4.07 | Very Satisfactory |
Legend: The ratings in the table are based on a point scale ranging from 1 to 5, with the following descriptive assessments: 5 (4.50–5.00): Outstanding, 4 (3.50–4.49): Very Satisfactory, 3 (2.50–3.49): Satisfactory, 2 (1.50–2.49): Fair 1 (1.00–1.49): Poor
Table 10 highlighted strong parental support for the SBFP, with high ratings for involvement in meal preparation (M = 4.09) and awareness of program goals (M = 4.38), reflecting active engagement and understanding of its benefits (Grantham-McGregor et al., 2007; Masset & Gitter, 2016). Parents also observed improvements in their children’s academic performance (M = 4.36), consistent with research linking nutrition to cognitive gains (Webb et al., 2018). However, lower scores for overall support (M = 3.79) and communication (M = 3.74) pointed to gaps in engagement and information sharing. These findings suggest a need for better communication strategies and increased opportunities for parental involvement to strengthen program outcomes and sustainability (Hoddinott & Kinsey, 2001; Dukhi, 2020).
SBFP Financial Allocation
Table 11. Evaluate Financial Allocation in SBFP Implementation Across Key Indicators
| Financial Allocation Indicators | Point Scale | Descriptive Rating |
| Healthy Meal Variety | 4.0 | Adequate |
| Training Funds for Staff | 4.45 | Adequate |
| Monitoring and Reporting Processes | 4.23 | Adequate |
| Effective Use of Financial Resources | 4.82 | Very Adequate |
| Adequate Budget for Nutritional Needs | 4.73 | Very Adequate |
| Weighted Mean | 4.45 | Adequate |
Legend: The ratings in the table are based on a point scale ranging from 1 to 5, with the following descriptive assessments: 5 (4.50–5.00): Very Adequate, 4 (3.50–4.49): Adequate, 3 (2.50–3.49): Moderately Adequate, 2 (1.50–2.49): Inadequate, 1 (1.00–1.49): Very Inadequate
Table 11 showed generally positive financial assessments of the SBFP, with strong ratings for budget adequacy (M = 4.73) and effective use of funds for meal preparation and distribution (M = 4.82), reflecting solid financial management (Bhutta et al., 2013; Masset & Gitter, 2016). However, monitoring and reporting on expenditures received a lower rating (M = 4.23), suggesting a need for better transparency and accountability (Webb et al., 2018). Funding for staff training (M = 4.45) was rated “Adequate,” pointing to opportunities to strengthen capacity-building efforts (Dukhi, 2020). The budget’s ability to support diverse, healthy meals was rated lowest at 4.00, indicating the need for more flexible or increased funding to enhance meal variety and nutrition (Alcantara & Frontreras, 2024). Overall, while financial management was effective, improving reporting systems, staff training, and food diversity could further enhance the SBFP’s impact and sustainability.
SBFP Facilities
Table 12. Assess SBFP Facilities in Supporting Program Implementation.
| SBFP Facilities Indicators | Point Scale | Descriptive Rating |
| The kitchen facilities used for meal preparation meet health and safety standards. | 2.60 | Moderately Adequate |
| Proper sanitation facilities (such as sinks and handwashing stations) are available for staff and students. | 4.18 | Adequate |
| The dining area provides a comfortable and safe during meal – times. | 3.69 | Adequate |
| The school conducts regular maintenance on the facilities used for the SBFP. | 3.45 | Moderately Adequate |
| The school has enough seating capacity to accommodate all students participating in the feeding program during meal – times. | 3.23 | Moderately Adequate |
| Weighted Mean | 3.43 | Moderately Adequate |
Legend: The ratings in the table are based on a point scale ranging from 1 to 5, with the following descriptive assessments: 5 (4.50–5.00): Very Adequate, 4 (3.50–4.49): Adequate, 3 (2.50–3.49): Moderately Adequate, 2 (1.50–2.49): Inadequate, 1 (1.00–1.49): Very Inadequate
Table 12 assessed SBFP facilities and revealed areas needing improvement. The kitchen received the lowest rating (M = 2.60, “Moderately Adequate”), indicating urgent upgrades are needed to meet health and safety standards and prevent foodborne illnesses (Webb et al., 2018; Bhutta et al., 2013). Sanitation facilities scored 4.18, suggesting basic systems exist but require enhancement to support better hygiene (Dukhi, 2020). The dining area was rated 3.69, pointing to the need for improved comfort and safety during meals, which can influence student satisfaction and participation (Grantham-McGregor & Baker-Henningham, 2007). Maintenance (M = 3.45) and seating capacity (M = 3.23) were both “Moderately Adequate,” highlighting the need for better upkeep and more space to accommodate all students. Addressing these gaps through facility upgrades and regular maintenance could enhance the SBFP’s safety, efficiency, and overall impact on student health and participation (Masset & Gitter, 2016).
SBFP Complementary Activities
The complimentary activities of the SBFP are; 1) School Garden and 2) Essential Health Care Program which are being implemented for years and it is being tied up to the SBFP to aid its successful implementation.
School Garden
Table 13. Assess School Garden Contribution to SBFP Implementation
| Indicators | Point Scale | Descriptive Rating |
| Vegetable production in the school garden is evident. | 3.52 | High Implementation |
| Availability of the vegetables for SBFP | 3.37 | Moderate Implementation |
| Utilization of the vegetables for SBFP is evident. | 3.32 | Moderate Implementation |
| Parents and local community members are engaged in school garden projects. | 3.34 | Moderate Implementation |
| Weighted Mean | 3.39 | Moderate Implementation |
Legend: The ratings in the table are based on a numerical scale, with the following interpretations: 5 (Attained 81-100%): Very High Implementation, 4 (Attained 61-80%): High Implementation, 3 (Attained 41-60%): Moderate Implementation, 2 (Attained 21-40%): Less Implementation, 1 (Attained 0-20%): Least Implementation
Table 13 evaluated the “School Garden” initiatives, with most areas rated as “Moderate Implementation.” Vegetable production scored highest at 3.52 (“High Implementation”), while availability (3.37) and utilization in the SBFP (3.32) showed room for improvement, suggesting underused potential (Webb et al., 2018). Parental and community involvement rated 3.34, also indicating moderate engagement and highlighting the need for stronger collaboration (Masset & Gitter, 2016). These findings suggest the need for improved strategies to boost garden productivity, increase integration with the feeding program, and deepen community participation. Enhancing funding, supply coordination, and stakeholder involvement could improve the garden’s contribution to student nutrition and education.
Essential Health Care Program
The Essential Health Care Program is one of the complimentary activities of the SBFP Implementation. The components of EHCP are handwashing with soap, toothbrushing with fluoride toothpaste and Bi-annual deworming. The program aims to address the problems on diarrhea, dental carries and intestinal parasitism.
Table 14. Evaluate Essential Health Care Program (EHCP) Implementation in SBFP.
| Essential Health Care Program Indicators | Point Scale | Descriptive Rating |
| Daily handwashing with soap routines. | 4.27 | High Implementation |
| Daily supervised tooth brushing with fluoride toothpaste practices. | 4.37 | High Implementation |
| Provide a Bi- annual deworming treatment. | 3.78 | High Implementation |
| Weighted Mean | 4.14 | High Implementation |
Legend: The ratings in the table are based on a numerical scale, with the following interpretations: 5 (Attained 81-100%): Very High Implementation, 4 (Attained 61-80%): High Implementation, 3 (Attained 41-60%): Moderate Implementation, 2 (Attained 21-40%): Less Implementation, 1 (Attained 0-20%): Least Implementation
Table 14 evaluated the Essential Health Care Program within the SBFP, showing strong implementation of key health practices. Daily handwashing scored 4.27 and supervised tooth brushing 4.37, both reflecting high adherence and alignment with research on hygiene’s role in preventing illness and promoting oral health (Webb et al., 2018; Grantham-McGregor & Baker-Henningham, 2007). Bi-annual deworming received a slightly lower rating of 3.78, indicating good implementation but some challenges in consistency (Dukhi, 2020). Overall, the program was effective, with improvements needed in ensuring timely and regular deworming to further enhance student health (Masset & Gitter, 2016).
Table 15. Evaluate Strategies in SBFP Implementation Across Key Indicators.
| SBFP Strategies Indicators | Point Scale | Descriptive Rating |
| Conduct nutritional Assessment | 4.91 | Outstanding |
| Identification of the SBFP beneficiaries | 4.91 | Outstanding |
| Creation of the SBFP core group | 4.19 | Very Satisfactory |
| Orientation on the program implementers | 4.55 | Outstanding |
| Commodities | 4.28 | Very Satisfactory |
| Procurement and delivery | 4.82 | Outstanding |
| Feeding Proper | 4.48 | Very Satisfactory |
| Storage and control | 3.64 | Very Satisfactory |
| Integration of School Garden | 3.71 | Very Satisfactory |
| Integration of the components of essential health care program | 4.45 | Very Satisfactory |
| Submission of reports | 4.82 | Outstanding |
| Program evaluation | 4.55 | Outstanding |
| Weighted Mean | 4.44 | Very Satisfactory |
Legend: The ratings in the table are based on a point scale ranging from 1 to 5, with the following descriptive assessments: 5 (4.50–5.00): Outstanding, 4 (3.50–4.49): Very Satisfactory, 3 (2.50–3.49): Satisfactory, 2 (1.50–2.49): Fair, 1 (1.00–1.49): Poor
Table 15 showed strong SBFP implementation, with top-rated strategies like “Nutritional Assessment” and “Identification of Beneficiaries” both scoring 4.91 (“Outstanding”), confirming effective targeting of at-risk students (Bhutta et al., 2013). “Procurement and delivery” and “Submission of reports” also earned “Outstanding” ratings (4.82), reflecting efficient logistics and communication (Webb et al., 2018). “Core group creation” (4.19), “Implementer orientation” (4.55), and “Feeding Proper” (4.48) were rated “Very Satisfactory,” highlighting solid team setup and meal delivery (Dukhi, 2020). “Commodities” (4.28) and “Storage and control” (3.64) suggested a need for better food management (Hoddinott & Kinsey, 2001). The lowest rating, “Integration of School Garden” (3.71), showed room to strengthen sustainability efforts. Overall, the program’s 4.44 weighted mean indicated strong performance, with improvements needed in storage and garden integration to boost long-term impact (Masset & Gitter, 2016).
SBFP Goals and Outcomes
The School Based Feeding Program has its three (3) major goals which are rehabilitate at least 60% of the severely wasted to normal nutritional status at the end of 100-120 feeding days; Ensure 85% to 100% classroom attendance of beneficiaries and improve academic performance at least 50% among the severely wasted learners.
SBFP Goals
The first goal in the SBFP implementation was to rehabilitate at least 60% of the severely wasted learners to normal nutritional status at the end of the 100-120 feeding days.
Table 16. Rehabilitation Outcomes of Severely Wasted Learners in SBFP for School Year 2023-2024
| Total Number of Severely Wasted Learners | Number of Learners Rehabilitated (From Severely to Normal) | Percentage % of Learners Rehabilitated |
| 192 | 125 | 65.10% |
Legend: Column 1: Total number of severely wasted learners, Column 2: Number of rehabilitated learners (from severely wasted to normal), Column 3: Percentage of learners rehabilitated
Table 16 showed that 125 out of 192 severely wasted learners in the SBFP were rehabilitated, resulting in a 65.10% success rate, reflecting the program’s positive impact on student nutrition (Webb et al., 2018; Bhutta et al., 2013). However, 34.90% were not fully rehabilitated, indicating gaps possibly due to inconsistent implementation, individual health issues, or socioeconomic challenges (Dukhi, 2020). This highlights the need for enhanced strategies such as individualized support, improved monitoring, and stronger stakeholder engagement to raise the rehabilitation rate. Overall, while the SBFP achieved moderate success, targeted efforts are needed to ensure more inclusive and sustainable outcomes (Grantham-McGregor & Baker-Henningham, 2007).
Beneficiaries Attendance Report
In addition, as shown in the table, the goal of ensuring 85% t0 100% classroom attendance of beneficiaries was rated 4.48 (High Attainment). According to the respondents, 85-100% attendances of the beneficiaries were ensured during the feeding.
Table 17. Comparative Analysis of Beneficiaries’ Attendance Before and After SBFP Implementation.
| Average Month
|
Percentage % Attendance Before the SBFP
|
Percentage % Attendance After SBFP |
| 1-7 | 96.57 | 98.86 |
Legend: Column 1: Average Month, Column 2: Percentage of attendance before the School-Based Feeding Program (SBFP), Column 3: Percentage of attendance after the School-Based Feeding Program (SBFP)
Table 17 showed that the SBFP positively impacted student attendance, with rates rising from 96.57% before implementation to 98.86% after—a 2.29 percentage point increase. This improvement suggests the program’s nutritional support enhanced students’ health, energy, and school participation (Webb et al., 2018; Bhutta et al., 2013). The rise in attendance also reflects increased motivation and engagement fostered by the program’s holistic approach (Grantham-McGregor & Baker-Henningham, 2007). Overall, the SBFP effectively promoted regular school attendance, highlighting its value in supporting both health and academic success, and reinforcing the need for its continued implementation and improvement (Masset & Gitter, 2016).
SBFP Beneficiaries Academic Performance
The tables below showed the Comparative Analysis of the First Grading Average Grade to the Final Average Grade of the severely wasted learners for the following data analysis: a) Paired sample t-test, and b) descriptive.
Table 18. Paired t-Test Results Comparing First Grading Average and Final Grade Average
| Measure 1 | Measure 2 | t | df | p | Mean Difference | SE Difference | |||||||||||
| First Grading Grade | – | Final Grade | -12.8 | 92 | < .001 | -1.83 | 0.142 | ||||||||||
Note. Student’s t-test.
Table 18 showed a statistically significant improvement in students’ academic performance, with a t-value of −12.8 (df = 92, p < .001), indicating a meaningful increase from the First to the Final Grading Average. The mean difference of −1.83 revealed an average grade increase of nearly two points, supporting the SBFP’s positive impact on learning outcomes. This aligns with research linking improved nutrition to enhanced cognitive function, motivation, and academic success (Grantham-McGregor & Baker-Henningham, 2007; Webb et al., 2018). Overall, the findings highlight the SBFP’s effectiveness as a dual intervention for both health and education, reinforcing the need for its continued support and expansion (Masset & Gitter, 2016).
Table 19. Comparative Analysis of Quarterly Assessment on Academic Performance
| Quarterly Assessment | N | Mean | Standard Deviation | Standard Error | Coefficient of variation | |||||||
| First Grade Average | 115 | 81.4 | 5.09 | 0.53 | 0.07 | |||||||
| Final Grade Average | 115 | 83.2 | 5.29 | 0.55 | 0.06 | |||||||
Legend: N: Number of participants (115) Mean: Average grade for each assessment period SD: Standard deviation, showing grade variation SE: Standard error, indicating mean precision Coefficient of Variation: Relative variability, calculated as SD/Mean
Table 19 showed an increase in mean academic scores from 81.4 to 83.2, suggesting a positive impact of the SBFP on student performance (Grantham-McGregor & Baker-Henningham, 2007). Low standard errors (0.53 and 0.55) and consistent coefficients of variation (0.07 and 0.06) indicate stable, uniform improvements across participants. These results support the idea that the SBFP contributes to both nutritional and academic success without widening performance gaps, reinforcing its role in promoting consistent educational outcomes (Masset & Gitter, 2016; Webb et al., 2018).
Problems Encountered in the SBFP Implementation
Table 20. Problems Encountered During SBFP Implementation and Their Frequency Ratings.
| SBFP Implementation Problems Encountered Indicators | Point Scale | Descriptive Rating |
| Delayed release of the budget for feeding program | 1.81 | Seldom a problem |
| Insufficient engagement from parents and the community to support for the program. | 2.19 | Seldom a problem |
| Absenteeism among beneficiaries due to health problems., low motivation, or other financial and social issues. | 1.73 | Seldom a problem |
| Pupil beneficiaries dislike eating vegetables. | 2.63 | Occasionally a problem |
| Some parents and pupil beneficiaries feel indifferent towards the feeding program and are ashamed of being recipients of the SBFP. | 1.67 | Seldom a problem |
| Recipients did not bring their own plates or spoon. | 1.09 | Never a problem |
| Challenges in meal preparation, including staffing shortages that hinder service delivery. | 1.36 | Seldom a problem |
| Experience difficulty in enforcing discipline among students during mealtime. | 1.17 | Never a problem |
| Lack of systematic monitoring and evaluation to assess the program’s impact and identify areas for improvement. | 1.19 | Never a problem |
| Some students do not eat breakfast at home and rely solely on the meals provided by the SBFP. | 2.05 | Seldom a problem |
| Experience delays in food delivery or supplies issues. | 1.64 | Seldom a problem |
| Difficulties in food delivery and transportation cause delays in meal provision. | 1.64 | Seldom a problem |
| Limited access to handwashing facilities and clean water supply for food safety and overall health. | 1.18 | Never a problem |
| Risks of foodborne illnesses due to improper food handling or storage practice. | 1.00 | Never a problem |
| Shortages in supplies such as food items, utensils, or cooking equipment that disrupt meal preparation and delivery. | 2.05 | Seldom a problem |
| Weighted Mean | 1.63 | Seldom a Problem |
Legend: The ratings in the table are based on a point scale, with the following interpretations: 5 (81-100%): Always a problem, 4 (61-80%): Almost always a problem, 3 (41-60%): Occasionally a problem, 2 (21-40%): Seldom a problem 1 (0-20%): Never a problem
Table 20 revealed that the SBFP faced minimal challenges, with an overall weighted mean of 1.63, rated as “Seldom a Problem,” indicating effective management and implementation. Minor issues such as missing utensils (1.09) and food safety concerns (1.00) were rarely encountered, showing strong adherence to hygiene and safety protocols (Hoddinott & Kinsey, 2001). Logistical concerns like delayed budget release (1.81) and transportation difficulties (1.64) were also minimal but suggested a need for improved resource delivery systems (Dukhi, 2020). However, some areas require attention. Beneficiaries’ dislike for vegetables (2.63, “Occasionally a Problem”) points to a need for improved nutrition education and more appealing meal options (Grantham-McGregor & Baker-Henningham, 2007). Limited parental and community involvement (2.19) also highlights the need to strengthen engagement for long-term program success (Masset & Gitter, 2016). Overall, while the SBFP ran smoothly, enhancing meal appeal, stakeholder participation, and logistical processes could further improve its effectiveness and sustainability.
Insights on Further Improving School-Based Feeding Program Implementation: Thematic Analysis
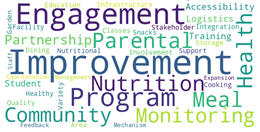
Figure 1. Infographic illustrated the results of a thematic analysis, shedding light on key areas that needing
improvement in the implementation of the School-Based Feeding Program (SBFP).
The infographic highlighted a program that prioritized health, nutrition, and community engagement, supported by research on the benefits of parental involvement in children’s well-being (Epstein, 2018). Parents played a key role in improving meal quality to ensure nutritious and enjoyable options for children (Gustafson & Rhodes, 2019). It emphasized building health and community partnerships, aligning with research on collaborative public health interventions (Bronfenbrenner, 1979). Schools, organizations, and stakeholders created a support network to sustain the program’s goals. Student engagement further reinforced these efforts, linking participation to improved health outcomes (Nutbeam, 2000). Logistics and accessibility were carefully addressed to overcome challenges in resource distribution noted in similar programs (Mason et al., 2020). Efficient delivery systems ensured equitable implementation and minimized barriers.
Findings
The study on the School-Based Feeding Program (SBFP) revealed strong leadership (M = 4.72), effective implementation, and high satisfaction among students (M = 4.43) and parents (M = 4.07), though parental involvement needs improvement. Supported by adequate funding (M = 4.45) and dedicated implementers (M = 4.43), the program improved attendance, academic performance, and rehabilitated 65.10% of severely wasted learners. However, infrastructure was only moderately adequate (M = 3.43), and areas like meal variety, community engagement, and school garden integration need enhancement. Health practices (M = 4.14) were well-implemented, but logistical issues and limited partnerships remain. For long-term success, the SBFP should focus on infrastructure upgrades, stronger collaboration, and consistent monitoring.
Conclusion
The study found that the School Based Feeding Program (SBFP) successfully met its key goals, showcasing strong leadership, effective financial management, and significant improvements in students’ health, attendance, and academic performance. Beneficiaries and parents were generally satisfied with the program, but there is still room to improve infrastructure, boost parental involvement, and build stronger ties with the community. Despite some logistical challenges, the program made a meaningful impact by rehabilitating severely wasted learners and showed great potential for lasting benefits. Moving forward, ensuring the program’s sustainability will require better resource allocation, ongoing monitoring, and stronger integration of initiatives like the school garden program.
Recommendations
To enhance the SBFP, key steps include engaging parents through workshops, upgrading kitchens and dining areas for safer environments, and providing nutritional support for severely wasted learners. Creative meal preparation and nutrition education can promote vegetable consumption. Strengthening community partnerships through the “School Garden” program can boost vegetable production. Increased funding for staff training, resources, and diverse meals is essential, alongside regular monitoring to identify improvements. Finally, reinforcing habits like handwashing and tooth brushing will support overall well-being and long-term program success.
The author extends heartfelt gratitude to all who contributed to this research. Special thanks to Dr. Caroline L. Guerta for her support in securing BERF inclusion, and to Dr. Violeta C. Nuñez for emphasizing the value of educational research. Appreciation is also given to Dr. Gregoria T. Su, Jasmin R. Lacuna, Dr. Gregorio C. Labrado, and Dr. Jeanette R. Isidro for their leadership and guidance. Deepest thanks to the author’s family for their constant encouragement, and above all, to the Almighty God for wisdom and guidance.