Impact of Digitalised Social Media Marketing on Consumer Purchasing Behavior among Millennials in Business Markets
*Tairat Abiola Titiloye1,2 , Rahmat Lasisi2,3,4 and Simbiat Yinusa4 and Ademola Lawal2 Simbiat Yinusa4, Success Afolabi4 and Summayah Layole4
1University of Hertfordshire, Hatfield, United Kingdom
2SAYNE Development Foundation, Lagos Nigeria
3Verraki Partner, Lagos
4Lagos State University, Ojo, Lagos
The swift advancement of digital technologies has profoundly altered marketing methodologies, with social media emerging as a preeminent factor in influencing consumer behavior. This research investigates the impact of social media marketing on the purchasing choices of consumers, with a particular focus on the Millennial demographic. Employing a quantitative research methodology, data was obtained via structured questionnaires, facilitating statistical examination of critical variables such as brand engagement, responsiveness, and consumer satisfaction. The result reveal that 94.94% of respondents use social media, with 88.68% accessing it daily. Over 81% of respondents indicated that social media brand pages provide sufficient product information to inform purchasing decisions. Additionally, 77.36% acknowledged that brand-related social media interactions (likes, shares, comments) influenced their opinions. Brands’ responsiveness to customer queries on social media was considered “quite responsive” by 53.55% of respondents. A Chi-Square test result (X² = 93.58, p < 0.05) indicated a significant relationship between social media marketing and consumer behavior. The research substantiates that brands exhibiting active social media participation enjoy enhanced consumer trust and loyalty, which in turn leads to elevated conversion rates. Therefore, social media marketing plays a crucial role in influencing consumer behavior, with frequent brand engagement and responsiveness significantly affecting purchasing decisions.
Keywords: Consumer-buying Behaviour, Social Media Marketing, Millennials, Brand Engagement, Digital, Business
Since marketing has existed for an extensive duration, it is imperative to grasp its definition in order to thoroughly understand the phenomenon of social media marketing. Approximately two decades ago, the commercial exchange of products and services predominantly occurred in physical retail establishments; however, the rapid progression of technology has facilitated the emergence of social media (Raji, & Titiloye, 2021). Marketing is defined by Green and Keegan (2020) as the systematic endeavor of creating, conveying, delivering, and exchanging goods and services that yield value for consumers, clients, business associates, and society. The focal point of marketing activities is an organization’s initiatives to fulfill consumer desires and requirements through the provision of competitively priced goods and services (Titiloye and Ige, 2025).
Varghese (2019) assert that the evolution of marketing practices over time has intensified competition and necessitated the adoption of contemporary marketing strategies in business. The transition from traditional brick-and-mortar retail to virtual platforms was propelled by technological advancements that engendered the internet. This technological evolution has enabled companies to disseminate information regarding their products and services directly to individual consumers, heralding a new era termed digital marketing` .
Strategic business planning is pivotal in the contemporary social engagement and digital communication landscape. As corporations increasingly engage in global competition, it is essential that marketing strategies incorporate progressively innovative and captivating approaches to attract a broader spectrum of consumers (Maulid et al, 2022; Okerinde & Titiloye, 2023). One of the transformative advancements that has reshaped the world is the advent of social media, which has transcended geographical barriers to establish connections among individuals globally (Arora et al., 2020).
The proliferation of social media, as posited by Appiah (2024), has engendered a novel ecosystem characterized by new modalities of interpersonal and professional interaction. It is exceedingly feasible to engage with the billions of users who frequent social media platforms such as Facebook, Twitter, Snapchat, and Instagram. Social media platforms, including blogs, Wikipedia, and networking sites, exemplify venues where collaborative efforts are conspicuous (Babu and Reddy, 2022).
Millennials presently allocate approximately 20 hours per month to the utilization of social media platforms, a trend attributed to the heightened prevalence of social media engagement (Umoh, 2025). Millennials exhibit proficiency in multitasking and generally do not exhibit allegiance to any singular social media platform. According to Adebafa (2024), the primary motivations for Millennials’ engagement with social media include maintaining interpersonal connections, staying informed about contemporary affairs, and seeking entertainment. Social media has emerged as a contemporary instrument employed by enterprises as a potent marketing mechanism to enhance client satisfaction, cultivate customer loyalty, and attract prospective clients while simultaneously retaining existing clientele (Elegbede et al., 2023a). Social media marketing encompasses the strategies employed by businesses to promote their products or services via social media channels to a broad audience (Mahesar et al., 2021). This practice, which is also referred to as social media marketing, involves leveraging social media platforms and technologies to engage with consumers and disseminate information regarding their products and services. Nevertheless, to foster brand loyalty, customer satisfaction possesses a significant impact on or influence over the purchasing decisions of consumers (Umoh, 2025; Elegbede et al., 2023b).
Social media has transformed into one of the most captivating platforms for fostering enduring relationships for both enterprises and individuals, as it fundamentally revolves around communication. Dahno et al., (2020) elaborated that social media marketing is essential to the interaction between corporations and their clientele. Moreover, it enables businesses to progress beyond merely augmenting their customer base through social media to enhancing overall client satisfaction.
To effectively employ social media marketing tools in altering consumer behavior, companies must ascertain the requirements of their clientele. This objective can be realized by maintaining an open line of communication with customers via social media platforms. Technological advancements have rendered the world a more compact and interconnected community, with social media emerging as a critical instrument for product introduction and sales to both current and prospective clients. Consequently, it is imperative to comprehend the influence of social media on consumer behavior (Hungevu et al., 2025).
The evolution of the internet has transfigured the world into a global village, facilitating real-time information exchange, thus expediting the proliferation of business activities on a global scale. Businesses have increasingly recognized the significance of utilizing social media marketing to promote their products and services to a diverse array of consumers. The consumers’ access to a wider spectrum of products and services has intensified competition, given the capability to engage a substantial number of customers.
The study’s goal is to examine how social media marketing influences Millennials’ and overall consumer behavior. The objective of this research is to investigate the impact of social marketing on consumer behavior and to discern whether social media marketing exerts any influence on how demographic factors such as gender, age, educational attainment, and income shaped consumer behavior. According to Rahardja and Kuncara, (2023), response time and consistent social media posting are two strategies within social media marketing that may significantly influence consumers’ purchasing decisions.
This section provides information about the study’s background, its aims and objectives and the study questions. A review of earlier literature is included in section 2. In section 3, the methodology and methods for this investigation was described in full. The study specifically covers the research design, research philosophy, research approach and strategy, population, sampling strategies, data sources, data collection instruments, data collection and analysis, sampling and research ethics. It also covers the questionnaire design and explanation. The topics covered in section 4 include data findings, analysis, results, and lastly the discussion about the findings.
According to Ziyadin et al. (2019), approximately 87 percent of individuals aged, 18 and older utilize the internet, with this statistic even more pronounced among certain demographic groups possessing higher income and educational attainment. The integration of the Internet, social media, mobile applications, and various digital communication platforms into the daily routines of billions of individuals is profound. Nevertheless, certain nations continue to impose restrictions on internet access, particularly concerning their citizens’ ability to engage with social media. Social media applications have increasingly gained traction as one of the most prevalent channels utilized by internet users. Given that a significant portion of the populace engages with social media for communication and interaction, leveraging these platforms to connect with customers is relatively straightforward. Organizations must acclimate themselves to these regulations to capitalize on the opportunities presented, as social media usage is subject to varying governance across different countries.
Ebrahimi et al. (2022) conducted an empirical investigation, and the objective of this manuscript is to elucidate the manner in which social network marketing (SNM) may influence consumers’ purchase behavior (CPB). An innovative methodological framework was employed, incorporating a fusion of structural equation modeling (SEM) and unsupervised machine learning techniques. The statistical population for the investigation was comprised of individuals residing in Hungary who engage with Facebook Marketplace.
Arbabi et al. (2022) utilized this research endeavor to illustrate the potential impact of social network marketing (SNM) on consumer purchase behavior (CPB). The hypotheses posited in this study are subjected to empirical validation through the integration of PLS-SEM and Necessary Condition Analysis (NCA) methodologies. The innovative methodological approach adopted encompasses the utilization of NCA, Importance-Performance Map Analysis (IPMA) matrix, permutation testing, Classification Tree Analysis (CTA), and FIMIX. The analysis is systematically structured into four phases: evaluation of the outer model, assessment of the inner model, examination of the NCA matrix, and analysis of the IPMA matrix. The statistical population of the study consisted of Instagram users who possessed prior experience in online purchasing.
Social Media Marketing and the Millennials
The advent of the internet and social media has fundamentally transformed interpersonal communication by eradicating geographical constraints and facilitating instantaneous message exchange. As posited by Charlesworth (2015), prior to the proliferation of the internet, interpersonal interactions were significantly limited by spatial separation and the inadequacy of communication mediums. Individuals were restricted to engaging with close acquaintances and associates situated within the same geographical vicinity. Conversely, contemporary digital cohorts, including millennials and Generation Z, are not encumbered by such limitations. Individualized content dissemination can now be effortlessly accomplished on a global scale utilizing devices as compact as smartphones.
The designation “Millennial Generation or Generation Y,” as elucidated by Blair (2017), pertains to individuals born between the years 1981 and 2002. Masi (2018) further characterizes this demographic as one that exhibits high levels of activity on social media platforms and a perpetual quest for novel information. Additionally, Koufie & Kesa (2020) and Rahmawati (2022) depict them as a novel cohort of astute and robust demographics currently integrated into the labor force, who are exceptionally challenging to influence, persuade, and retain as customers due to their vigorous engagement on social media platforms. Research conducted by Jaafar, and Khan, (2022) indicates that approximately thirty percent (30%) of millennials have been reported to utilize social media as a means of determining purchasing decisions. According to the same study, 29% of millennials acknowledged that they acquire information regarding new enterprises and their offerings through social media advertisements, while forty-eight percent (48%) confessed to actively searching for products and services via social media.
The predominant demographic utilizing social media as a source of purchasing inspiration comprises millennials. A recent global survey conducted by PwC discovered that 37% of Millennial consumers derived their inspiration and ideas for purchases from social media platforms. Furthermore, a more recent investigation by GFK, a data analytics firm catering to the consumer products sector, indicates that a considerable fraction of U.S. consumers engaging in purchases through social media are individuals belonging to this age bracket.
The reach and utilization of social media are experiencing rapid expansion in tandem with the growth of the global digital populace. Social networks, which afford users access to a diverse array of information, are readily available and are poised to continuously transform the modalities through which businesses and individuals communicate on a global scale. Social media platforms have transitioned from being perceived primarily as communication tools for younger generations to being routinely employed for business-related endeavors and social interactions by individuals across various age groups. According to estimates from the World Bank, the global population was approximated to be around 7.89 billion individuals in 2021, while Statista projected the total number of social media users worldwide to be 4.67 billion, reflecting a penetration rate of 59.4% of the total population. The millennial generation, comprising approximately 1.8 billion individuals globally and constituting 23% of the world’s population, is reported to engage actively with social media in nearly 90% of instances.
The approaches was employed to address the questions raised in this research from the beginning of this study are also covered in this section. The researcher dealt with methods of examining the objectives of this study, which includes the determination of social media marketing on consumer purchasing behavior of millennials and whether or not demographic factors like gender, age, income, and education can affect how consumers behave. The social media activities that could influence consumer’s buying behavior towards brands goods and services and response time by the brand, regular updates on brand goods and services.
Research Approach and Framework
Since the goal of this study is to examine how social media marketing affects millennials’ consumer behavior, a systematic description of the population is required, and a quantitative approach was employed. A descriptive research design was use to answer the research questions as it is appropriate in investigating more than one variable and systematically describes the population under study. Using a descriptive research design, which Saunders et al. (2019) describes, as a type of quantitative method that enables the description of a population phenomenon, is appropriate for this study. Maulid et al, (2022) supported them by postulating that through descriptive design, participants’ responses were used to represent those of a larger population. According to Manyanga et al., (2024), the research designs are methods and techniques that a researcher employs to collect data and measure the relationship between variables that are stated in the research questions. During the course of this study, the researcher analyzed data acquired from a specific group for a comprehensive analysis of the topic being researched. As the aim of this research is to analyze the influence of social media marketing on consumer behavior among millennials, a systematic description of the population is required, and a quantitative approach was employed.
A descriptive research design was also used to answer the research questions as it is appropriate in investigating more than one variable and systematically describes the population under study. Using a descriptive research design, which Saunders et al. (2019) describes as a type of quantitative method that enables the description of a population phenomenon, is appropriate for this study. Maulid et al, (2022) supported them by postulating that through descriptive design, participants responses are used to represent those of a larger population. According to Manyanga et al., (2024) the research designs are methods and techniques that a researcher employs to collect data and measure the relationship between variables that are stated in the research questions. During the course of this study, the researcher analyzed data acquired from a specific group for a comprehensive analysis of the topic being researched.
In this study, a quantitative approach was used by the researcher to produce numerical data that could then be statistically analyzed to provide appropriate responses to the research questions. The use of quantitative methods to investigate how social media marketing affect customer behavior is primarily driven by the ability to collect data from a large number of participants and analyze it to produce thorough results that are representative of the entire population. In the quantitative approach, primary methods and secondary sources was used in the collection of data and survey questionnaires are one of the primary methods or sources (Manyanga et al., 2024). These techniques for gathering data are used to generate quantitative information, that satisfies research goals such as; the relationship between social media marketing tool usage and consumer behavior, a better understanding of the impact social media marketing has in influencing the behavior of Millennials’, and the potential for social media marketing to affect behavior of consumers based on demographic factors such as age, gender, level of education, and finance.
Data Collection Method
There are two methods of data collection, and they are primary and secondary. Therefore, the initial goal of accessing secondary data is to ascertain whether the study goal can be accomplished using them (Whitmore, 2021). There would not be a requirement for primary data collection if the researcher has access to sufficient secondary data to meet the research objectives. The primary data were collected directly through interviews, questionnaires, surveys and experiments. Primary data were sourced to answer new research questions, to affirm results of earlier research and research new demographic trends (Manyanga et al., 2024). While the secondary data according to Moses and Yamat (2021) are data that have been sourced by other researchers and are in books, journals, reports, newspapers and databases.
Whitmore, (2021) explained that the earlier methods used to collect primary data include in-person interviews, phone surveys, mail surveys, and mail intercepts. Nonetheless, unlike past approaches, the technical revolution that gave rise to digital technologies has made it simple to gather vast amounts of data, both qualitative and quantitative, and to integrate them into databases at very little cost. According to their findings, around 70% of recent surveys use these new electronic techniques of sending questionnaires and gathering data. The study’s primary focus is on how social media marketing affects consumer behavior, particularly among millennials. Data for this study was collected by mailing questionnaires to the selected respondents with the researcher sending out 350 ethics consent forms. Questionnaires for data collection during this research were sent to only respondents that filled and returned the ethics consent form that was earlier sent to them which had guaranteed them of their anonymity and confidentiality during the research process. All data collected was stored in the University of Hertfordshire server for security and confidentiality purpose. All data collected from respondents was destroyed after completion of this research.
Secondary Resources
Secondary research is a kind of research that is usually done at home or in a library using either or both printed sources and the Internet. In secondary research, the researcher will use pre-existing data sources such as marketing reports, census data, business news websites, news reports, and magazine articles, rather than gathering any new primary data.
Primary Research
According to Sprake and Palmer, (2022), primary research entails the gathering of unique data that is pertinent to a particular subject using research procedures like surveys or interviews. By conducting primary research, the researcher directly obtains information from the original source. There are various ways that primary research could be carried out using the questionnaires for respondents when gathering primary data. It could be through direct personal interview, through phone interview, emailing of questionnaires to respondents, to mention but a few. For this study, the researcher sent the questionnaires to respondents through email because of its convenience for both the researcher and the respondents and unlike other methods; it is believed that this method will have a higher return rate.
The primary data for this study was collected using a survey questionnaire designed by the researcher for the purpose of this research and sent to the respondents to collect quantitative data on how they are being influenced by social media in dealing with producers of goods and services. 150 questionnaires were sent out to respondents and all 150 questionnaires was returned. The survey questions used based on the research questions are closed-end questions that are confidential and does not include the identity of the respondents. All questions in the questionnaire are general questions that will help the researcher gain an in-depth knowledge about how the demographic population are influenced by social media marketing.
Sampling
The demographic group for this study is the millennials also known as Gen Y, a group who were born during technological revolution that brought about the internet and social media and they form the majority of the working class. Their response was used to gain an insight into the research questions. Most businesses target this class of people because they are the working class and spend more purchasing goods.
According to Schmiedeberg and Schröder (2024), it is not possible to analyze an entire population, as there will not be enough time and resources to achieve it. Hence the decision of the researcher to use an appropriate sampling technique for this research purpose. There are two sampling methods, the probability and non-probability methods. The probability method includes simple, systematic, stratified and cluster. While the non-probability methods are quota, purposive, volunteer and haphazard. Since there are, more than one characteristic to be dealt with in the research questions, and in order to make the data collection of this research as simple and straightforward as possible, the researcher chose to use the stratified random sampling technique.
Questionnaire Design and Explanation
The research questions served as the basis for the closed-ended survey questions that were developed. In order to show appreciation, the researcher sent a thank-you note after assuring the respondents of their privacy. The survey will not require respondents name for anonymity, as the questions are private.
Table 1: Questionnaire design and Explanation
| Are you male or female? | The study will put the gender of the respondents into consideration to know how each gender is affected |
| Were you born between 1981 and 1996? | This study focuses on millennials, and they are people born between 1981 and 1996 |
| What is the highest level of education obtained? | This question tends to investigate if education has any impact on the behavior of respondents. |
| What is your occupation? | This question looks at the occupation of each respondent and how it affect their social media usage |
| What is your average annual income? | This question of the study will analyze how income affects the behavior of consumers |
| Do you use social networking sites? | This question is the basis for the entire study and only those that answer in the affirmative will be needed for the study |
| What is the frequency of your social media usage? | This question will measure how often respondents refer to social media for information |
| What is the average time you spend on social media networking daily? | This question will show how much each respondent spend averagely on social media and how this can affect their buying behavior |
| How often do you shop online? | This question is meant to provide information about the purchase behavior of each of the participant |
| Do the brand social media pages give you enough information to make purchase choices? | This question gives an insight as to how participants are influenced by brand information on social media |
| Do social media posts, comments, shares, or likes relating to particular brands influence you to change your opinion? | This question shows how respondents are influenced by the opinions of other social media users |
| Do prefer shopping online or in physical shops? | This question shows participants preference between online shopping and physical shopping |
| Which is your preferred social media platform? | A number of social media platforms is listed and participants are to choose their preferred ones |
| Do you share your positive or negative online buying experiences with others by leaving comments? | This question shows how respondents try to influence others with their comments |
| How responsive are brands to your concerns or queries through social media? | Respondents use this question to show if brands respond to their queries or not |
| Compared to your expectations, how pleased are you with the goods and services that businesses advertise on social media? | This question help highlight participants expectations from producers of goods and services |
| On what scale would you say that social media tools encourage you to shop online? | This last question shows how respondents are influenced by social media tools |
Source: Authors Copy.
Online Survey
An online survey, often known as an internet survey, is one of the most popular ways to collect data. In this method, a target sample is given a list of survey questions, and the recipients can respond to the questions electronically. The questionnaires for this research was sent to participants through the internet and their response to the questions was gathered and sorted by the researcher online.
There are two sections in this chapter where the research findings and data analysis are presented. In the first section, the data obtained was analyzed in order to answer the research questions and complete the objective of the study which is to look at how social media marketing influences consumer behavior. The study’s other goals included figuring out how social media marketing affects consumers’ decisions to repurchase products and giving businesses advice on how to use social media marketing to boost sales. A content analysis was performed on the data that was gathered. Analyses of the respondents’ demographics are also provided in the first section of this chapter.
The second section examines information gathered regarding the impact of social media marketing on consumers. In addition, each component contains data that have been integrated from the study’s primary sourced data through survey questionnaires that was sent to 168 respondents.
Following descriptive and inferential analysis, frequency distributions, bar charts, numerical measures, and tables were used to show the data. Both the descriptive and inferential methods were used to analyse the data that had been gathered. Using the data gathered, predictions could be made using the inferential statistical method, while the descriptive statistics described the characteristics of the data collection. After data from the sample had been collected, inferential statistics were used to comprehend the larger population from which the sample had been drawn. Regression analysis, ANOVA, Chi Square, and Pearson’s correlation analysis were all used in the inferential statistics. Regression analysis, ANOVA, Chi Square, and Pearson’s correlation analysis were all used in the inferential statistics. For the purpose of evaluating the data, the descriptive statistics used percentages, means, medians, frequencies, standard deviations, and quartile ranges.
This study intends to determine how social media marketing affects consumer-purchasing behavior, particularly among Millennials who commonly use social media platforms to make purchases. The following topics will be specifically covered:
Research Question
The main problem of the research will be solved by answering the research questions and this will assist the researcher in developing a better technique for the problem approach and inquiry and ensure that the goals and objectives are achieved. As stated by Sultan et al., (2022), the primary research problem will be resolved in parts by answering the research questions.
The research questions are as follows:
Research Question 1
Research Question 2
Research Question 3
Section 1 – Findings
A total of 168 participants responded to the questionnaire forwarded to them electronically. This sub-section discusses the demographic characteristics of the survey participants.
Gender
According to Figure 1 below, 43.66% of the participants in the study were male and 56.34% were female. This demonstrates that there was almost a balance in the gender mix, and since there is a little discernible difference, this will be used in the following analysis.
Table 2 – Gender of Participants
| # | Field | Minimum | Maximum | Mean | Std Deviation | Variance | Count |
| 1 | Are you male or female? | 1.00 | 2.00 | 1.56 | 0.50 | 0.25 | 142 |
Source: Created by Qualtrics (2023)
| # | Answer | % | Count |
| 1 | Male | 43.66% | 62 |
| 2 | Female | 56.34% | 80 |
| Total | 100% | 142 |
Source: Created by Qualtrics (2023)
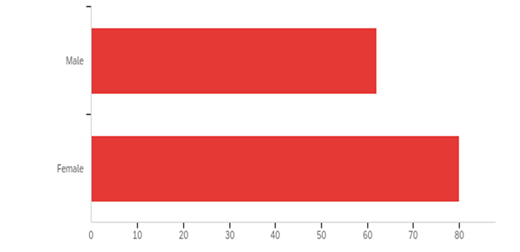
Figure 1: Gender of Participants
Age
The targeted participants for this survey are those born between 1981 and 1996. According to Figure below, 88% of the participants that received the questionnaires are within the targeted age range while 12% did not fall within the age range.
Table 3: Generation of participants
| # | Field | Minimum | Maximum | Mean | Std Deviation | Variance | Count |
| 1 | Were you born between 1981 and 1996? | 1.00 | 2.00 | 1.12 | 0.32 | 0.11 | 159 |
Source: Created by Qualtrics (2023)
| # | Answer | % | Count |
| 1 | Yes | 88.05% | 140 |
| 2 | No | 11.95% | 19 |
| Total | 100% | 159 |
Source: Created by Qualtrics (2023)
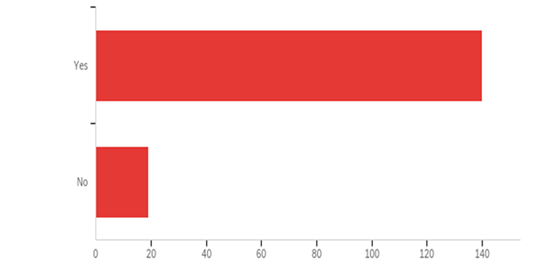
Figure 2: Generation of participants (born between 1981 and 1996).
Source; Created through Qualtrics (2023)
Education
None of the participants have less than a high school degree. Approximately 8% of the participants have high school degree, while 6.29% of the participants attended college with no degree. Only 3.14% of participants have associate degree. Over half the number of participants 59.75% are those with bachelor’s degree, while 22.64% of the participants have graduate degrees.
Table 4: Highest level of education obtained
| # | Field | Minimum | Maximum | Mean | Std Deviation | Variance | Count |
| 1 | What is the highest level of education obtained? | 2.00 | 6.00 | 4.82 | 1.10 | 1.21 | 159 |
Source: Created by Qualtrics (2023)
| # | Answer | % | Count |
| 1 | Less than high school degree | 0.00% | 0 |
| 2 | High school degree or equivalent | 8.18% | 13 |
| 3 | College but no degree | 6.29% | 10 |
| 4 | Associate degree | 3.14% | 5 |
| 5 | Bachelor’s degree | 59.75% | 95 |
| 6 | Graduate degree | 22.64% | 36 |
| Total | 100% | 159 |
Source: Created by Qualtrics (2023)
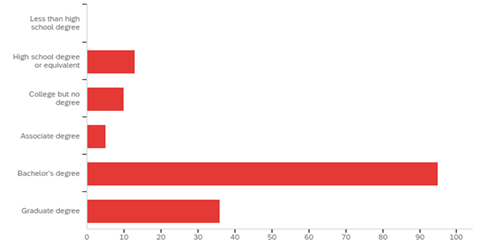
Figure 3: Highest level of education obtained.
Occupation
Figure 4 illustrates that around 17.31% of respondents are students, while 47.44% are of the working class and 20.51% of the participants are entrepreneurs. It also shows that 3.21% of study participants are service men and women, while 2.56% of the participants are unemployed and 8.97% of participants are among others.
Table 5: Occupation of participants
| # | Field | Minimum | Maximum | Mean | Std Deviation | Variance | Count |
| 1 | What is your occupation? | 1.00 | 6.00 | 2.53 | 1.37 | 1.89 | 156 |
Source: Created by Qualtrics (2023)
| # | Answer | % | Count |
| 1 | Student | 17.31% | 27 |
| 2 | Employee | 47.44% | 74 |
| 3 | Entrepreneur | 20.51% | 32 |
| 4 | Service | 3.21% | 5 |
| 5 | Unemployed | 2.56% | 4 |
| 6 | Others | 8.97% | 14 |
| Total | 100% | 156 |
Source: Created by Qualtrics (2023)
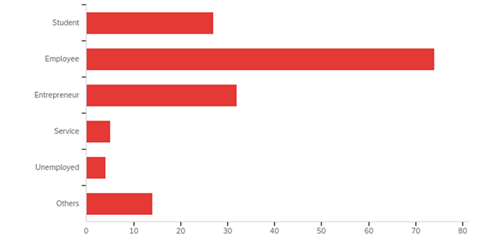
Figure 4: Occupation of participants
Income
Figure 5 illustrates that the majority of research participants (74.52%) earn less than £24,000 each year. About 20.38% of study participants make between £24,000 and £50,000 per annum and 5.10% of study participants have a monthly income of above $50,000 annual income.
Table 6: average annual income
| # | Field | Minimum | Maximum | Mean | Std Deviation | Variance | Count |
| 1 | What is your average annual income? | 1.00 | 3.00 | 1.31 | 0.56 | 0.31 | 157 |
Source: Created by Qualtrics (2023)
| # | Answer | % | Count |
| 1 | Less than £24,000 | 74.52% | 117 |
| 2 | £24,000 – £50,000 | 20.38% | 32 |
| 3 | Above £50,000 | 5.10% | 8 |
| Total | 100% | 157 |
Source: Created by Qualtrics (2023)
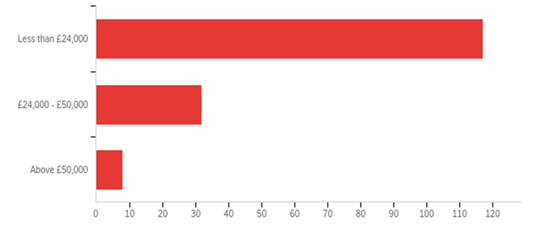
Figure 5: Average annual income
Social Media
As shown in figure 6 below, 94.94% of participants admits to using social media networking, while 5.06% of participants says they are not into social media networking of any kind.
Table 7: Social Media Networking
| # | Field | Minimum | Maximum | Mean | Std Deviation | Variance | Count |
| 1 | Do you use social networking sites? | 1.00 | 2.00 | 1.05 | 0.22 | 0.05 | 158 |
Source: Created by Qualtrics (2023)
| # | Answer | % | Count |
| 1 | Yes | 94.94% | 150 |
| 2 | No | 5.06% | 8 |
| Total | 100% | 158 |
Source: Created by Qualtrics (2023)
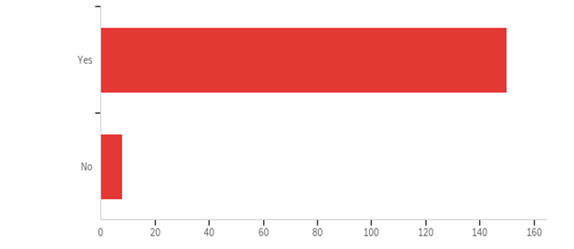
Figure 6: Social Media Networking
Frequency of Social Media usage
Participants were asked how often they use social media, 88.68% said they use it daily, 3.77% of the participants said they use it twice weekly, and 5.66% said they use social media only once in a week. 0.63% of participants said they use it monthly, while 1.26% said they only use the social media only once or twice annually.
Table 8: Frequency of social media usage of participants
| # | Field | Minimum | Maximum | Mean | Std Deviation | Variance | Count |
| 1 | What is the frequency of your social media usage? | 1.00 | 5.00 | 1.22 | 0.69 | 0.47 | 159 |
Source: Created by Qualtrics (2023)
| # | Answer | % | Count |
| 1 | Daily | 88.68% | 141 |
| 2 | Twice a week | 3.77% | 6 |
| 3 | Weekly | 5.66% | 9 |
| 4 | Monthly | 0.63% | 1 |
| 5 | 1-2 times yearly | 1.26% | 2 |
| Total | 100% | 159 |
Source: Created by Qualtrics (2023)
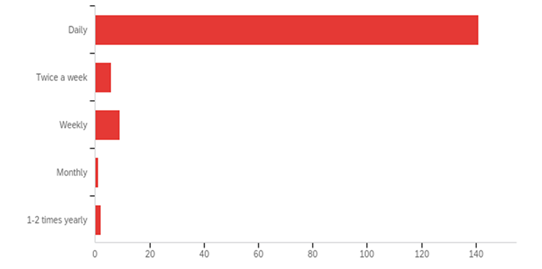
Figure 7: Frequency of social media usage of participants
Time spent on social media networking.
Majority of the participants (59%) spend less than 5 hours daily on social media networking while 30% of the participants spend between 5 to 10 hours daily on social media, and 11% spends more than 10 hours daily on social media as shown in figure 8 below.
Table 9: Average time spent on social media networking daily
| # | Answer | % | Count |
| 1 | Below 5hrs | 59% | 93 |
| 2 | 5 – 10hrs | 30% | 47 |
| 3 | Above 10hrs | 11% | 17 |
| Total | 100% | 157 |
Source: Created by Qualtrics (2023)
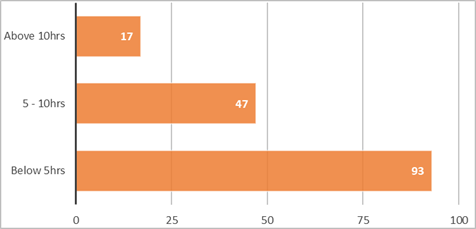
Figure 8: Average time spent on social media networking daily.
How often participants shop online?
Table 10: How often participants shop online?
| # | Field | Minimum | Maximum | Mean | Std Deviation | Variance | Count |
| 1 | How often do you shop online? | 1.00 | 3.00 | 1.75 | 0.63 | 0.40 | 159 |
Source: Created by Qualtrics (2023)
| # | Answer | % | Count |
| 1 | I rarely shop online | 35.85% | 57 |
| 2 | I do some of my shopping online | 53.46% | 85 |
| 3 | I do most of my shopping online | 10.69% | 17 |
| Total | 100% | 159 |
Source: Created by Qualtrics (2023)

Figure 9: How often participants shop online?
Brand information through social media
Participants were asked if brands social media pages gives them enough information to make purchase decisions, 81.13% said yes while 18.87% said no.
Table 11: Social media brand information.
| # | Field | Minimum | Maximum | Mean | Std Deviation | Variance | Count |
| 1 | Do the brand social media pages give you enough information to make purchase choices? | 1.00 | 2.00 | 1.19 | 0.39 | 0.15 | 159 |
Source: Created by Qualtrics (2023)
| # | Answer | % | Count |
| 1 | Yes | 81.13% | 129 |
| 2 | No | 18.87% | 30 |
| Total | 100% | 159 |
Source: Created by Qualtrics (2023)
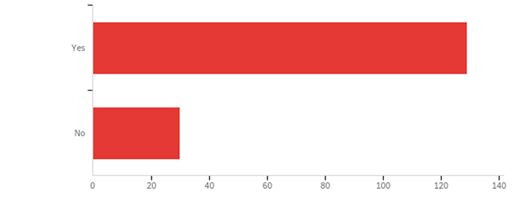
Figure 10: Social media brand information.
Social media posts, comments, shares and likes.
Figure 11 shows participants answer to the question asking if social media posts, comments, shares, or likes relating to brands help influence their opinions, 77.36% said yes and 22.64% said no.
Table 12: Do social media posts, comments, shares, or likes relating to particular brands influence participants’ opinions?
| # | Field | Minimum | Maximum | Mean | Std Deviation | Variance | Count | |||
| 1 | Do social media posts, comments, shares, or likes relating to particular brands influence you to change your opinion? | 1.00 | 2.00 | 1.23 | 0.42 | 0.18 | 159 | |||
Source: Created by Qualtrics (2023).
| # | Answer | % | Count |
| 1 | Yes | 77.36% | 123 |
| 2 | No | 22.64% | 36 |
| Total | 100% | 159 |
Source: Created by Qualtrics (2023).
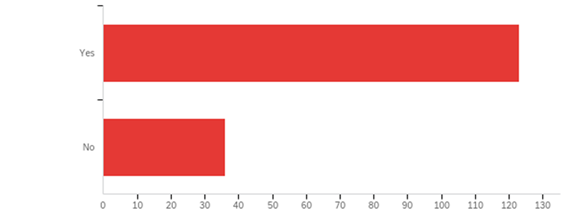
Figure 11: Do social media posts, comments, shares, or likes relating to particular brands influence participants’ opinions?
Preference for online or physical shop
Participants were asked for their preference between online shopping and physical shopping, 48.10% said they prefer online shopping while 51.90% said they prefer shopping in physical shops.
Table 13: Preference for shopping online or in physical shops
| # | Field | Minimum | Maximum | Mean | Std Deviation | Variance | Count | |||
| 1 | Do prefer shopping online or in physical shops? | 1.00 | 2.00 | 1.52 | 0.50 | 0.25 | 158 | |||
Source: Created by Qualtrics (2023)
| # | Answer | % | Count |
| 1 | Yes | 48.10% | 76 |
| 2 | No | 51.90% | 82 |
| Total | 100% | 158 |
Source: Created by Qualtrics (2023)
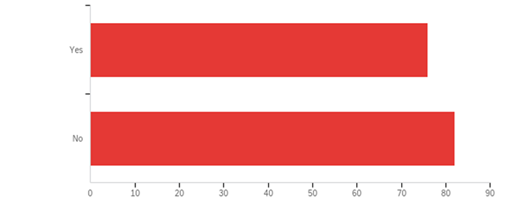
Figure 12: Preference for shopping online or in physical shops
Preferred social media platforms.
The preferred social media sites used by the study participants include YouTube, Instagram, Twitter, Myspace, Facebook, LinkedIn, Tik-Tok, and Snapchat. The vast majority of participants use Instagram (45.05%) and (24.05%) use Facebook. As also shown in Figure 13, 8.91% of the survey participants use Twitter, compared to 8.42% who use YouTube, 3.96% who use Tik-Tok, both LinkedIn and Snapchat users are 3.47% each and 1.98% who uses Myspace. The majority of these social media platforms are used to promote or sell various brands and products, and as a result, may have a significant impact on consumer satisfaction.
Table 14: Most preferred social media platforms
| # | Answer | % | Count |
| 1 | 24.75% | 50 | |
| 2 | 45.05% | 91 | |
| 3 | 3.47% | 7 | |
| 4 | MySpace | 1.98% | 4 |
| 5 | Snapchat | 3.47% | 7 |
| 6 | Tik-Tok | 3.96% | 8 |
| 7 | 8.91% | 18 | |
| 8 | YouTube | 8.42% | 17 |
| Total | 100% | 202 |
Source: Created by Qualtrics (2023)
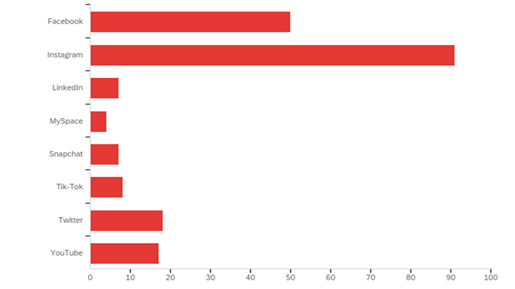
Figure 13: Most preferred social media platforms
Social media experience
According to Figure 14, 58.60% of participants said that they share their online experiences with others by leaving comments, while 41.40% said they do not.
Table 15: Sharing online experiences with others
| # | Field | Minimum | Maximum | Mean | Std Deviation | Variance | Count |
| 1 | Do you share your positive or negative online buying experiences with others by leaving comments? | 1.00 | 2.00 | 1.41 | 0.49 | 0.24 | 157 |
Source: Created by Qualtrics (2023)
| # | Answer | % | Count |
| 1 | Yes | 58.60% | 92 |
| 2 | No | 41.40% | 65 |
| Total | 100% | 157 |
Source: Created by Qualtrics (2023)
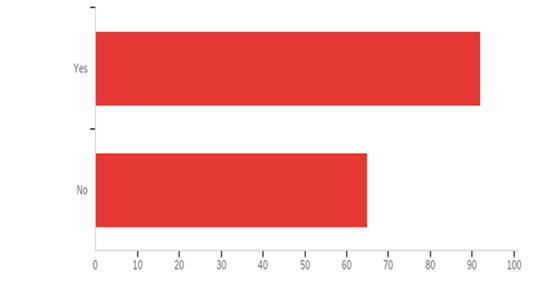
Figure 14: Sharing online experiences with others
Brands Responsiveness
The response to question on how responsive brands are to queries and concerns through social media, 53.55% which is a majority of the participants said that brands are somewhat responsive, with 25.16% of participants saying that they are not responsive to queries, while 20.65% says that they are very responsive and 0.65% says they are extremely responsive.
Table 16: Brands responsiveness to concerns and queries
| # | Field | Minimum | Maximum | Mean | Std Deviation | Variance | Count |
| 1 | How responsive are brands to your concerns or queries through social media? | 1.00 | 4.00 | 1.97 | 0.69 | 0.48 | 155 |
Source: Created by Qualtrics (2023)
| # | Answer | % | Count |
| 1 | Not so responsive | 25.16% | 39 |
| 2 | Somewhat responsive | 53.55% | 83 |
| 3 | Very responsive | 20.65% | 32 |
| 4 | Extremely responsive | 0.65% | 1 |
| Total | 100% | 155 |
Source: Created by Qualtrics (2023).

Figure 15: Brands responsiveness to concerns and queries.
Comparing expectations with advertised goods and services
Figure 16 showed the response to question on how pleased participants are with goods and services advertised on social media, 0.63% of the participants said they are very dissatisfied, 4.43% of participants said they are just dissatisfied, 55.06% said they are neutral, 36.71% said they are satisfied and 3.16% said they are very satisfied.
Table 17: How pleased are respondents with the goods and services advertised on social media.
| # | Field | Minimum | Maximum | Mean | Std Deviation | Variance | Count |
| 1 | Compared to your expectations, how pleased are you with the goods and services that businesses advertise on social media? | 1.00 | 5.00 | 3.37 | 0.65 | 0.42 | 158 |
Source: Created by Qualtrics (2023)
| # | Answer | % | Count |
| 1 | Very dissatisfied | 0.63% | 1 |
| 2 | Dissatisfied | 4.43% | 7 |
| 3 | Neutral | 55.06% | 87 |
| 4 | Satisfied | 36.71% | 58 |
| 5 | Very satisfied | 3.16% | 5 |
| Total | 100% | 158 |
Source: Created by Qualtrics (2023).
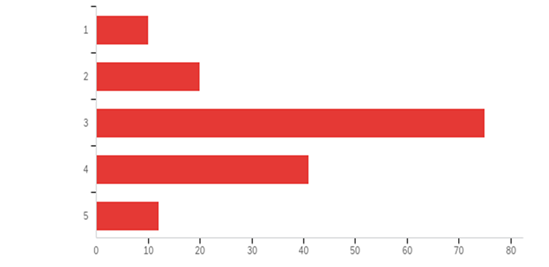
Figure 16: How pleased are respondents with the goods and services advertised on social media.
how social media encourage users to shop?
In answering this question, most of the participants are between 3 and 4 showing that social media encourages users to shop for goods and services.
Table 18: Scale on social media influence
| # | Field | Minimum | Maximum | Mean | Std Deviation | Variance | Count | ||||
| 1 | On what scale would you say that social media tools encourage you to shop online? | 1.00 | 5.00 | 3.16 | 0.96 | 0.92 | 158 | ||||
Source: Created by Qualtrics (2023)
| # | Answer | % | Count |
| 1 | 1 | 6.33% | 10 |
| 2 | 2 | 12.66% | 20 |
| 3 | 3 | 47.47% | 75 |
| 4 | 4 | 25.95% | 41 |
| 5 | 5 | 7.59% | 12 |
| Total | 100% | 158 |
Source: Created by Qualtrics (2023).

Figure 17: Scale on social media influence
168 people responded to the survey, and it is clear from their responses that 94.94% of them utilize social media, with 88.68% of them doing so every day. Over 60% of respondents, according to the survey, shop for goods and services online, either in full or in part. More than 81% of respondents claim that businesses provide sufficient information about their products and services on their social media pages to enable consumers to make informed decisions. In addition, 77.36% of respondents acknowledge that social media comments, shares, and likes from other users have a bearing on their perceptions of certain goods and services, and 58.60% of respondents claim to also share their own product and service-related experiences on these platforms. About 70% of participants claim that companies respond to their inquiries and complaints made on social media. Participants’ direct responses to survey questions provide evidence that brands’ usage of social media marketing can affect the buying behaviour of consumers.
Section 2 – Analysis
Chi-Square test, Pearson’s correlation analysis, and ANOVA were conducted to test the influence of social media marketing on consumer behaviour by answering the research questions.
The First Research Question
To what extent is the influence of social media marketing on consumer behaviour?
Chi-Square Test Statistic
X2=Σ(O-E)2/E
Table 19: Chi-Square Statistics
| 1 | 2 | 3 | 4 | 5 | |
| O | 10 | 20 | 75 | 41 | 12 |
| E | 31.6 | 31.6 | 31.6 | 31.6 | 31.6 |
| (O-E)2 / E | 14.76 | 4.26 | 59.61 | 2.80 | 12.16 |
Source: Created by author (2023)
To ascertain whether there is a statistically significant and positive or negative association between social media marketing tools and consumer behavior, the Chi-Square test was used. The calculated value of the test statistics X2 is 93.58 and the critical value of X2 from the chi-square distribution table is 9.49. As a result of our test statistic above the crucial value, the null hypothesis will be rejected. This suggests that there is enough information to conclude that social media tools have direct impact on customer behavior.
The positive values on the results of the chi-square tests for item 17 of the questionnaire suggested a positive association between social media marketing tools and consumer behavior. The Chi-Square test clearly shows that there was a statistically significant association between consumer behavior and social media marketing tools. According to these Chi-Square results, using social media tools is one of the social media activities that is a substantial and relevant factor, for influencing purchasing behavior among consumers, who use social media. Social media tools have a positive and significant impact on consumer behavior toward brands. Consequently, the first study question is addressed by the fact that social media tools have a substantial influence on changing customer behavior.
The Second Research Question
How does social media marketing affect consumer behaviour?
Table 20: Pearson’s Correlation Analysis
| Social media marketing tools | Consumer satisfactions | ||
| Social media marketing tools | Pearson’s correlation | 1 | 0.145*** |
| Sig. (2 tailed) | .000 | ||
| N | 158 | 158 | |
| Consumer behavior | Pearson’s correlation | 0.145*** | 1 |
| Sig. (2 tailed) | .000 | ||
| N | 158 | 158 |
Source: Created by author (2023)
Correlation is significant at the 0.001 level (2-tailed).
According to Table 4.1 above, social media marketing tools and consumer behavior are positively correlated, which was duly described by the Pearson’s correlation analysis as y(r = 0.145, n = 158, p =.000). The connection was significant at the 0.001 level, indicating a strong role for social media marketing tools in influencing how a consumer behaves towards goods and services. As demonstrated in the table above, the correlation analysis also statistically reveals a significant linear association between how consumers behave towards brands products and social media marketing tools (p < .001). The above table also shows that the positive r values imply a favorable relationship between social media marketing tools and consumer behavior. The positive direction of the correlation or association suggests that these factors frequently play a significant role or positively influence one another. Social media marketing tools have shown that it has a significant impact on how consumer sometimes behaves and have the potential to change how these consumers interact with companies that produce goods and services. The above table also shows that the correlation between social media marketing tools and consumer behavior is modest in strength/magnitude. The issue raised by the second question has now been addressed thanks to the correlation analysis, which revealed the positive and considerable impact social media marketing tools have on consumer behavior.
The Third Research Question
How does social media marketing impact consumer behavior? One way ANOVA is applied to answer this question.
Table 21: Anova: Single Factor
| Summary | ||||||
| Groups | Count | Sum | Average | Variance | ||
| Column 1 | 5 | 15 | 3 | 2.5 | ||
| Column 2 | 5 | 158 | 31.6 | 1503.8 | ||
| Anova | ||||||
| Source of Variation | SS | df | MS | F | P-value | F crit |
| Between Groups | 2044.9 | 1 | 2044.9 | 2.71513 | 0.138014 | 5.317655 |
| Within Groups | 6025.2 | 8 | 753.15 | |||
| Total | 8070.1 | 9 | ||||
To determine whether consistent social media posting by brands has a substantial impact on influencing consumer behavior, a single factor analysis of variance (ANOVA) was also carried out. Five levels of consumer satisfaction were utilized to categorize the questions used to gather information on the impact of continuous social media posting by companies to influence the behavior of consumers, (1-Very dissatisfied; 2-Dissatisfied; 3-Neutral; 4-Satisfied, and 5-Very satisfied). Those that participated in the study rated their level of satisfaction with the statements showing how effective the consistent posts by companies on social media in an effort to sway customer behavior using the five scales.
Table 21 above shows the single factor ANOVA findings which indicate that there was a statistically significant association between the effects of consistent brand posting on social media and customer satisfaction level, with F (1, 8) = 2.171513 and p < .001. These figures also shows that there is a beneficial relationship between continuous social media posting by businesses and the impact they have on consumer behavior through their level of satisfaction. From the data compiled, 58 participants being satisfied and five (5) very satisfied, although 87 of the participants are neutral, still shows that consistent social media posting has a considerable impact in influencing consumer-buying behavior. The fact that seven (7) participants are dissatisfied with one very dissatisfied does not change the outcome of the analysis. Although considerable discrepancies in participant replies reflect diverse opinions by participants on if social media can affect consumer behaviors, it is clear that consistent social media posting plays a very important role in influencing the buying behavior of consumers.
To answer the research questions and determine whether the study’s goals and objectives were met statistical procedures such Chi-square analysis, Pearson’s correlation analysis, and analysis of variance were utilized in this section. This section uses chi-square statistics to respond to the first question, “How much does social media marketing influence consumer behavior?”; Pearson’s correlation analysis to respond to the second question, “How does social media marketing affect consumer behavior? “; and single factor analysis of variance to respond to the third question, “How does social media marketing impact consumer behavior?” (ANOVA). The characteristics influencing customer behavior in social media marketing are being identified, and a greater understanding of how demographic factors like gender, age, educational attainment, and income influence social media marketing behavior has been established.
The findings, which helped to address the research questions and realize the goals and the study objectives on the influence that social media marketing has on consumer behavior, were able to show that social media marketing tools are crucial in influencing consumer behavior. Some of the social media marketing activities covered by this research include posting by brands on a regular basis, responding to consumer questions and concerns, and providing brand information on social media. These social media activities made it possible for existing consumers to express their viewpoints through posts and reviews. Based on the manner of interaction, consumer communication leads to the development of either favorable or unfavorable views about goods and services, which can result in the purchase of or a boycott of such goods and services. Social media user evaluations of a product’s merits may influence the decision of other prospective customers to purchase it.
The study’s findings indicate that the aforementioned social media activities significantly influence how customers make decisions in relation to the purchase of required products and services. It was determined from their responses and the survey questions that nearly all respondents agreed to using social media platforms for one activity or another, which proves that social media has grown to be a crucial part of daily communication between brands, their customers, and consumers interested in the same product and service, which is currently an essential marketing tool for businesses to expand their market audience.
Technology is advancing quickly, and social media platforms are growing faster and better as a result. Regular interactions between consumers and service providers have helped in the advancement of social media marketing. Those born between 1981 and 1996 also known as Millennials are the study’s target population, and its goal is to investigate how social media marketing affects consumers in the target range.
Response times by companies to customer issues and queries can influence whether or not those customers choose to purchase a particular product or service or search for alternatives. Customers, for instance, are frequently swayed by businesses’ prompt replies to their concern and queries because these actions have a positive and significant impact on raising customer satisfaction. Consumers may form a negative impression of a brand and lose interest in it if manufacturers, retailers, and distributors of goods and services that use social media to advertise are unaware of the value of promptly responding to their customers’ questions and concerns.
It has been established that company’s’ social media posts about their brand, their activities, their goods, and services may significantly affect how consumers view them and what they create, which can have a big impact on how they behave towards these companies when making purchase decisions. Consumer interest in these companies’ goods and services can only be aroused by the presentation of that information about what they produce, and their customer journey experiences posted by their customers on their social media pages.
According to the study’s participants’ responses, brands can pique consumers’ interest in their goods and services by providing them with useful and engaging information at all times. Consumers who visit companies’ social media pages may be more likely to make wise purchasing decisions if these companies are successful in stimulating their curiosity by providing intriguing information about their goods and services. Regular business information posting on social media platforms can have a big impact on how consumers behave toward their products and services. Additionally, it can keep customers informed about new products and services, price changes, and any incentives that companies may be providing that might affect consumer behavior.
The behavior of both current and prospective customers of the products of these companies can be greatly influenced by other social media activities like comments, shares, and likes of satisfied consumers. When businesses are able to consistently feature their newest products on their social media sites, satisfied and interested customers can help them spread the word by sharing it so that their friends and family can see it. This can help businesses receive a lot of likes and positive comments from consumers. Such remarks, likes, and shares can sway customers to act favorably toward the products and services of that company. On the contrary, when potential customers visit the social media page of a company and do not find enough information to arouse their interest, such customers tend to move on to the site of other manufacturers or retailers of the goods and services that could satisfy their needs.
Sharing of their shopping and customer service experiences by consumers on social media is another crucial activity that can have a big impact on how other potential consumers behave when it comes to purchasing a brand’s goods and services. This experience-sharing is a method of evaluating the brand’s attitude toward its customers and how those customers perceive and transmit that attitude to other customers. These social media activities are important drivers of consumer behavior that could affect their choice to buy products or how they feel about a particular brand, product, or company. As a result, they can be used to provide insights into how to use social media to increase customer engagement and satisfaction.
Looking at the response of the participants about their social media usage, it is clear that they are all using the most current and well-liked platforms, like Instagram and Twitter, Facebook, and YouTube which helps in demonstrating the value of social media marketing in influencing consumers’ purchasing decisions. Because consumers are interested in new goods and ideas and want to remain informed, it is crucial that brands provide current information on these platforms. However, there was no agreement on a specific social media platform that might serve as the main tool for social media marketing, although the majority are voted for Facebook and Instagram, it is possible that this is because many of these sites are relatively new and that more are being created quickly that might attract many social media users.
Sharma (2020) made a connection between social media marketing and the purchasing behaviour of consumer, proving the efficiency of social media marketing as a marketing strategy that affects consumers’ perceptions and, ultimately, their purchase decisions. This was supported by Kumar et al. (2024), who claimed that a variety of aspects of consumer behaviour are influenced by social media, information gathering, opinions, impressions, purchasing patterns, contact with customers after the sale, and evaluation.
The preceding studies corroborate the findings of the current research, which indicated that a substantial proportion of the study’s participants concurred that social media marketing exerts an influence on consumers’ shopping behaviors. This investigation reaffirmed that prompt brand responses to consumer grievances and inquiries can play a significant role in shaping consumer behavior. This research conclusion is substantiated by the prior work of Charlesworth (2015), who posited that social media has effectively diminished the barriers of distance between individuals, thereby facilitating instantaneous message exchanges, and is further supported by the findings of Cao et al. (2021), which suggest that businesses seeking direct interactions with their consumers must now routinely implement social media strategies.
The demographic focus of this study encompasses individuals born between 1981 and 1996, a cohort recognized as one of the principal groups engaging frequently with social media platforms. The findings indicated that female participants outnumbered their male counterparts within this demographic, with a majority holding a bachelor’s degree, being employed in various capacities, and classified as low-income earners.
The study was systematically divided into two distinct sections, with the initial part analyzing the data derived from the 168 participants and drawing conclusions pertinent to the research questions posed. In the subsequent section, three statistical methodologies were utilized to address the three research inquiries and to assess whether the research aims and objectives were achieved. The results reveal that a predominant number of participants agreed that social media marketing influences consumers’ purchasing behaviors. Organizations derive multiple benefits by actively engaging their clientele through social media platforms. Provided that the appropriate audience is effectively targeted, social media marketing has the potential to enhance brand visibility. By promoting products and services, this targeted audience can contribute to sales increases and, ultimately, enhanced brand recognition. As articulated by Agbele et al., (2019), one significant advantage of social media marketing is its ability to elevate brand awareness among users across various social media platforms. Consequently, businesses aspiring to broaden their market reach must remain informed and continuously assess their social media marketing strategies. Given its extensive user base of billions worldwide, social media serves as an instrumental mechanism for market penetration, facilitating a business’s access to specific target market segments. Social media is an essential tool for engaging with consumers, as it enables businesses to monitor public sentiment regarding their products and promptly address inquiries. Anawade and Sharma, (2022) assert that effective communication must exist among the various segments of the market chain to cultivate relationships. Such connections can be fostered through social media, and Yang (2021) contends that regular interaction with customers provides a competitive advantage in the marketplace.
Utilizing social media can significantly enhance business operations, allowing organizations to gauge customer perceptions regarding their products and services. Businesses can also address customer issues or complaints on the social media site to make sure that they are always satisfied in order to gain their constant loyalty.
Finally, customer direct input through the company’s various social media platforms can aid in product or service improvement which can help increase the brands customer base. Social media, as opposed to other forms of advertising, offers businesses an affordable way to inform current and prospective customers about their products and services. Brands can promote their goods and services through social media sites such as Facebook, Instagram, and others for no additional cost beyond their internet subscription.
The study was used to affirm the influence of social media marketing on consumer behavior. Survey questionnaires were sent out to participants electronically and the response to the questions and the analysis of the response confirm the result of earlier researchers, which states positively that social media marketing activities can help influence the behavior of existing and potential consumers.